ng’ara
Home
Blog
Apps & Links
Semba-blog Analysis
Semba Data Analysis
Kwala commercial CIty
Marine Hub
Environmental Master Plan
Hydrographic Data Hub
Potential Fishing Zones
TAFIRI Apps
R Weekly
R Bloggers
Highcharter
Archive
Categories
All
(26)
Analysis
(17)
Aquaculture
(1)
Data
(1)
Fisheries
(1)
Manipulation
(5)
Modelling
(5)
Programming
(1)
Python
(7)
R
(8)
Spatial
(5)
Visualization
(21)
code
(1)
Order By
Default
Title
Date - Oldest
Date - Newest
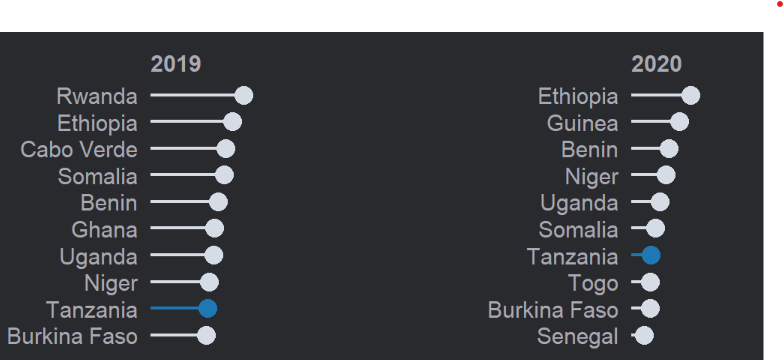
Plotting with ggcharts Package in R
Analysis
Visualization
Data visualization is an essential tool for data analysis and interpretation. R is a popular programming language for…
July 2, 2023
Masumbuko Semba
9 min
Information Management Strategy for Coastal and Marine Data
Spatial
Analysis
Visualization
Coastal and marine data is crucial for various stakeholders, including government agencies, non-governmental…
May 23, 2023
Masumbuko Semba
5 min
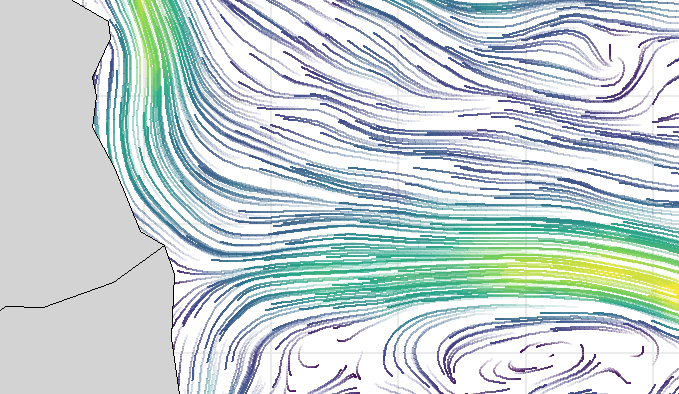
Streamlines for Surface Currents in Coastal Waters of Western Indian Ocean Region
Spatial
Analysis
Visualization
Streamlines are imaginary lines that are tangent to the velocity vector at every point in space. They represent the…
May 20, 2023
Masumbuko Semba
16 min
The Skill Gap in Data Science
R
Python
Data
Programming
As we celebrate Labour Day on 1st May 2023, it’s important to reflect on the changing nature of work and the skills…
May 1, 2023
Masumbuko Semba
3 min
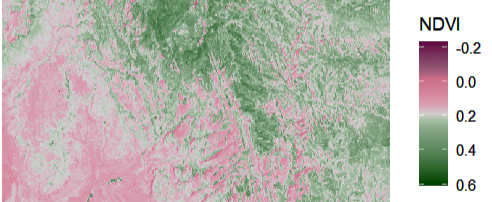
Compute Normalized Difference Vegetation Index in R
Spatial
Analysis
Visualization
In this post, we’re going to learn how to compute Normalized Difference Vegetation Index (NDVI) from Landsat imagery…
April 28, 2023
Masumbuko Semba
5 min
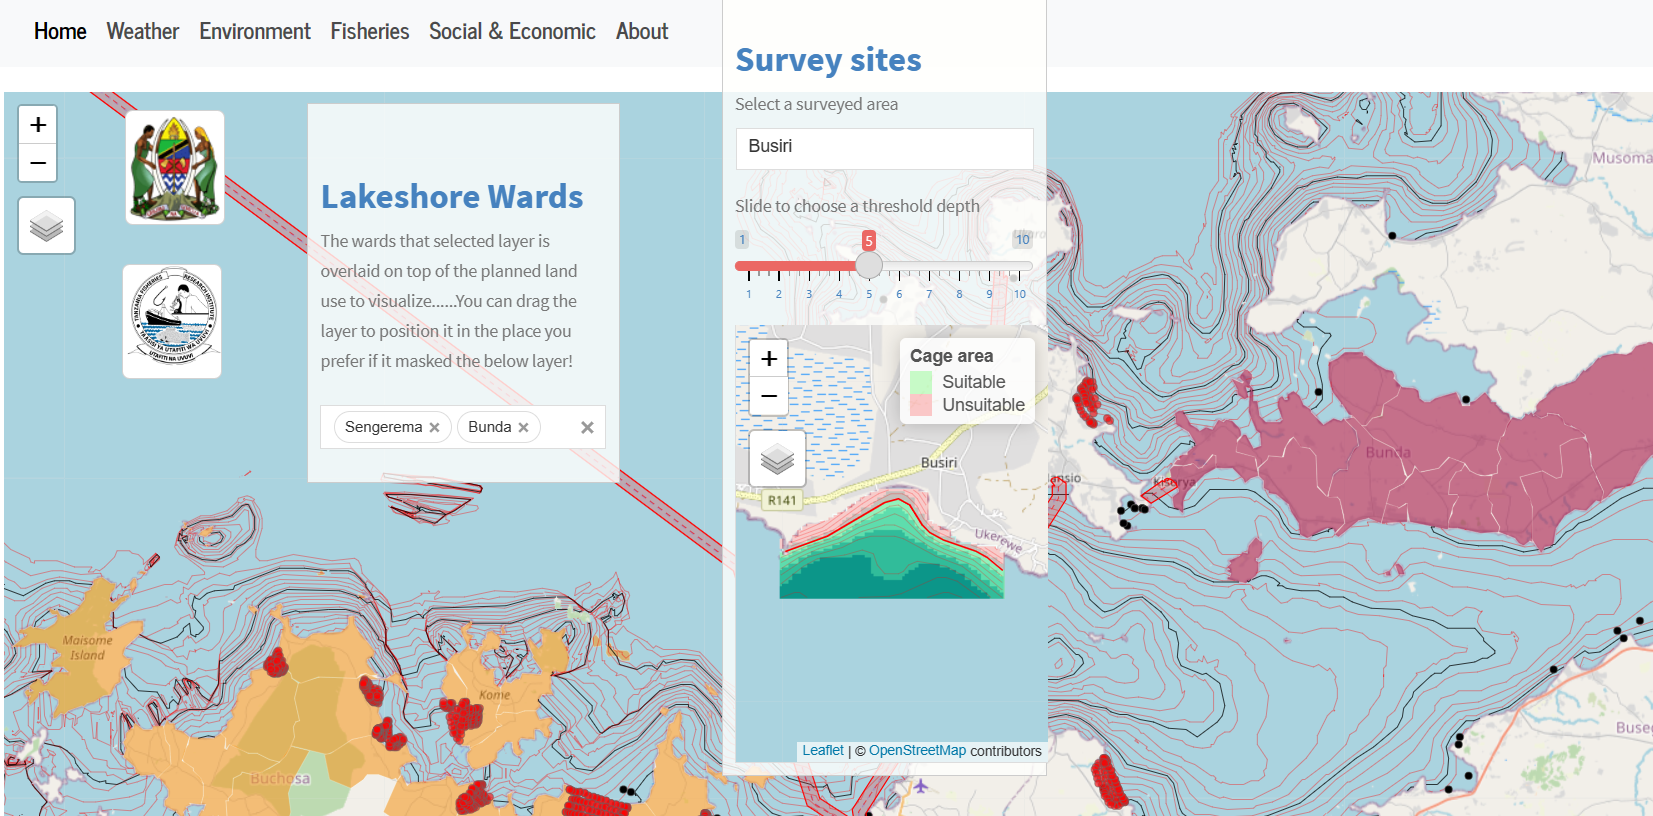
Interactive Web Application for Cage Aquaculture in Lake Victoria
Fisheries
Aquaculture
Cage aquaculture is a promising way to increase fish production in Tanzania’s Lake Victoria
(Kashindye et al., 2015; Or…
April 17, 2023
Masumbuko Semba
3 min
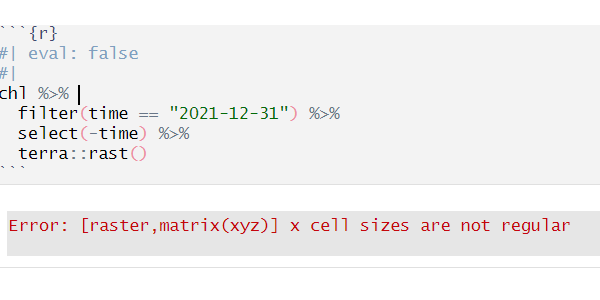
How to handle irregular cell size error when creating Raster in R
R
Modelling
In this blog post, I will discuss how to create a spatraster object from a data frame in R. This can be a useful tool…
April 16, 2023
Masumbuko Semba
6 min
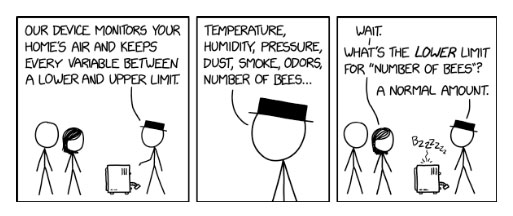
Will Your Data Science Programming Skills Be Replaced with Artificail Intelligence?
R
Modelling
In recent years, the rise of artificial intelligence (AI) and machine learning (ML) has led to the development of…
April 15, 2023
Masumbuko Semba
6 min
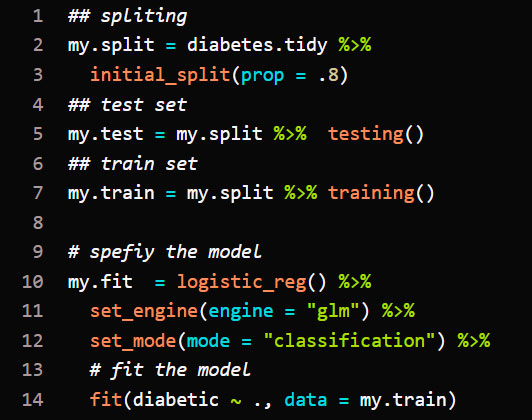
Machine learning with tidymodels: Binary Classification Model
Manipulation
Visualization
R
Modelling
In this post, we’ll learn how to create Machine learning models using R. Machine learning is the foundation for…
April 13, 2023
Masumbuko Semba
15 min
Machine learning with tidymodels: Linear and Bayesian Regression Models
Manipulation
Visualization
R
Modelling
We live in age of increasing data and as a data scientist, our role primarily involves exploring and analyzing data.…
April 11, 2023
Masumbuko Semba
14 min
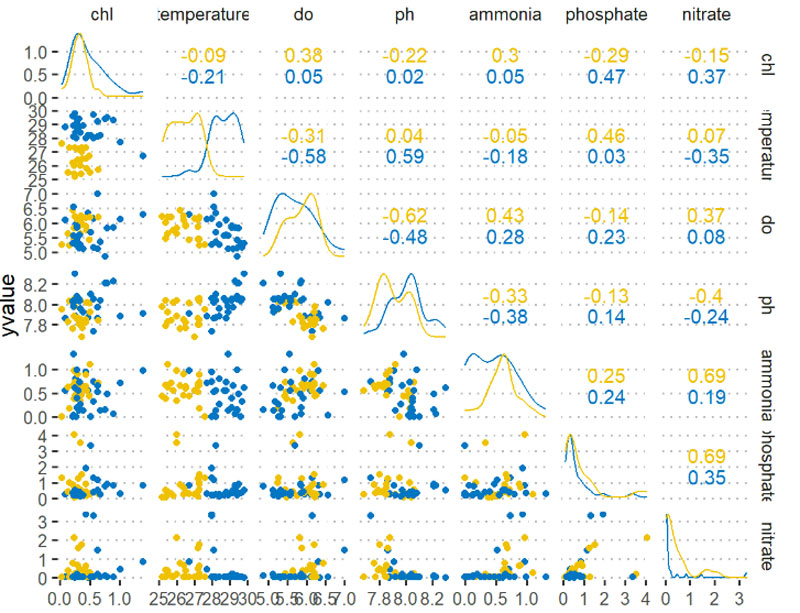
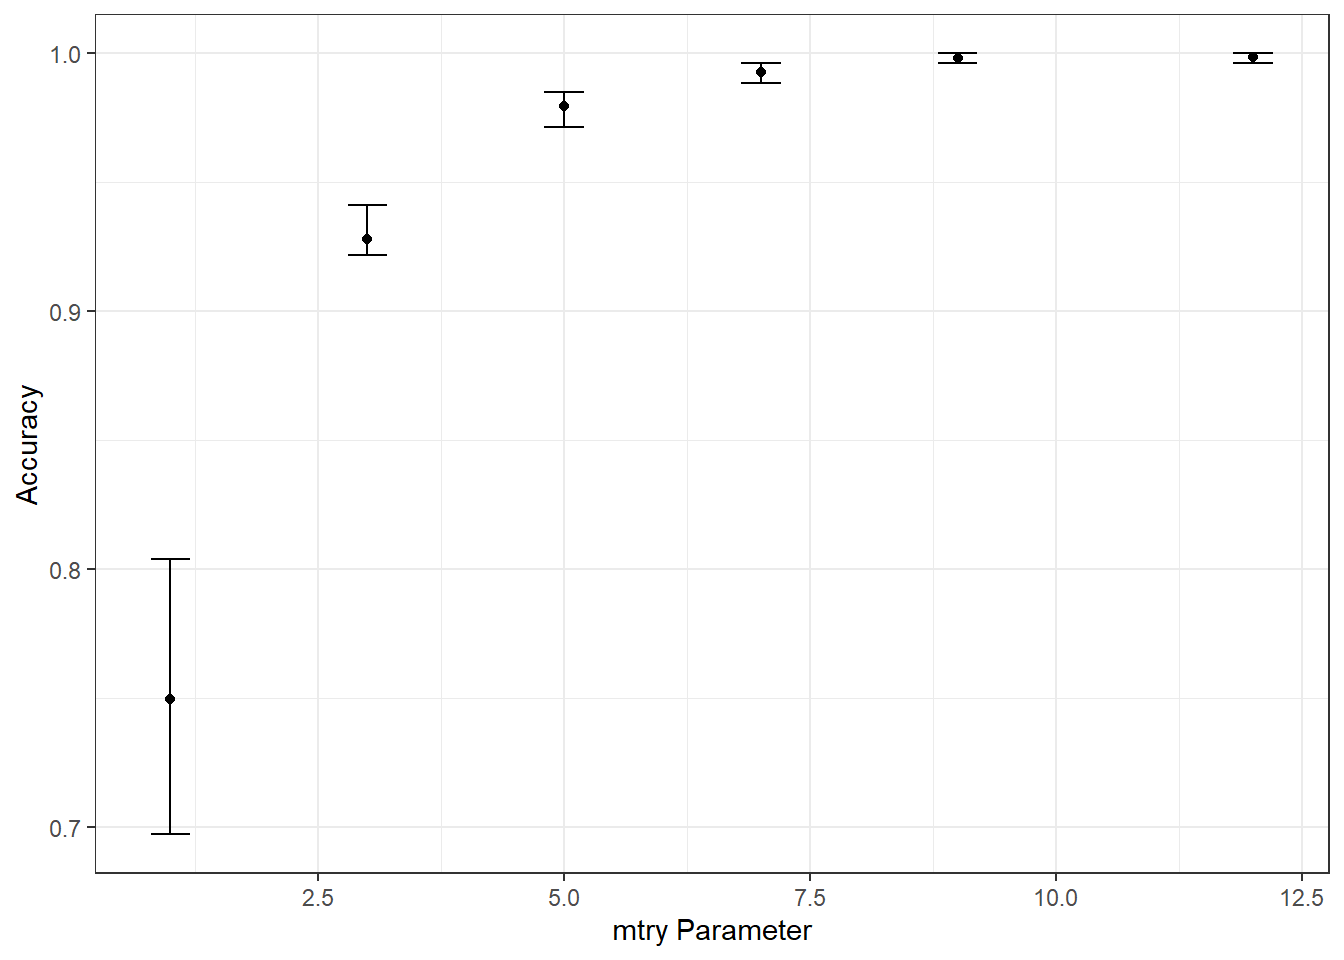
Machine learning with tidymodels: Classification Models
Manipulation
Visualization
R
Modelling
Classification
is a form of machine learning in which you train a model to predict which category an item belongs to.…
April 3, 2023
Masumbuko Semba
8 min
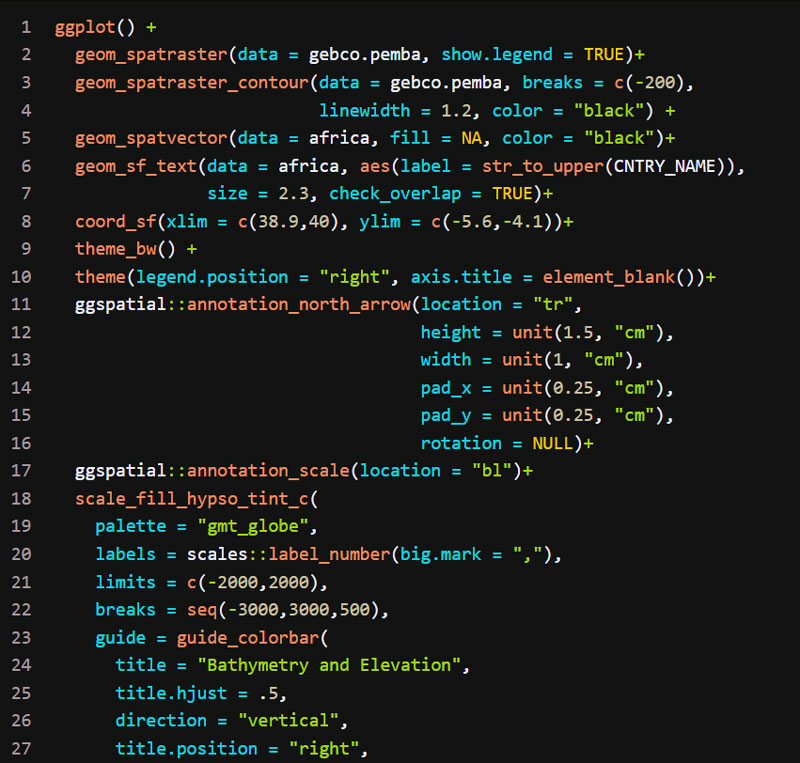
Getting GEBCO Bathymetry Data and glean the power of terra and tidyterra packages for raster and vector objects
Manipulation
Visualization
R
As an Oceanography, one key parameter that need to get right is the bathymetry. Bathymetry is the science of…
March 1, 2023
Masumbuko Semba
11 min
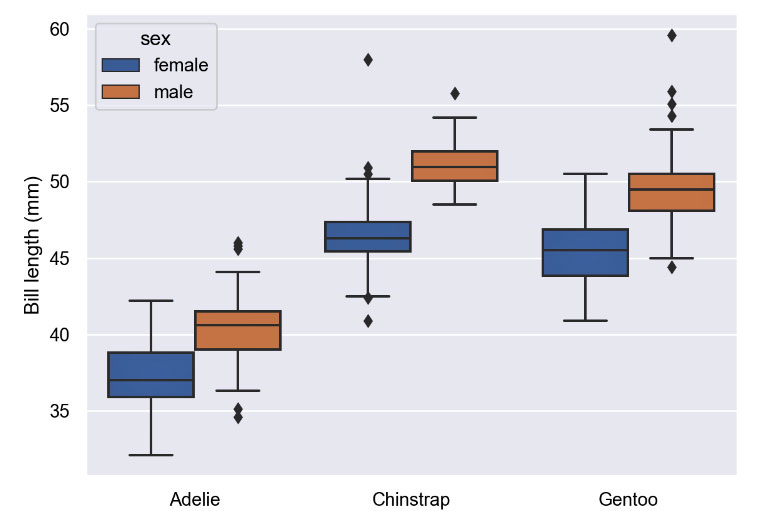
plotting in Python with Seaborn: box plot
Analysis
Visualization
Python
In Visualization with Seaborn of this series, we were introduced on the power visualization and dove into…
February 24, 2023
Masumbuko Semba
3 min
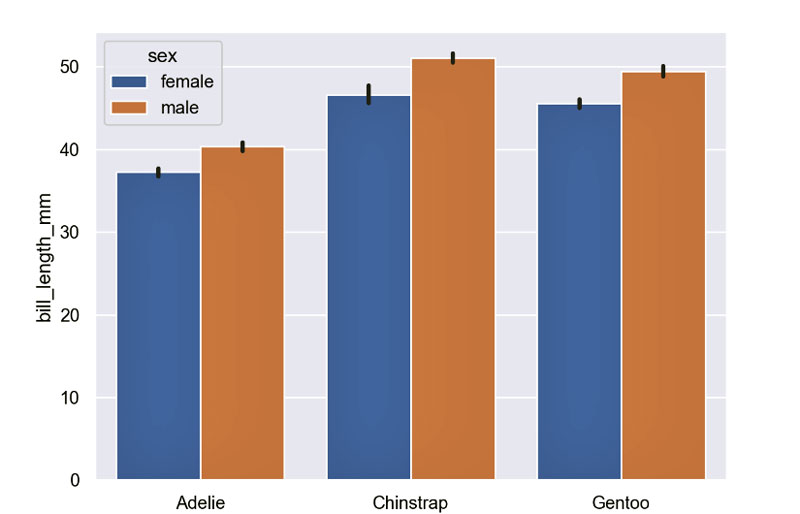
plotting in Python with Seaborn: bar plot
Analysis
Visualization
Python
In Visualization with Seaborn of this series, we were introduced on the power visualization and dove into…
February 23, 2023
Masumbuko Semba
2 min
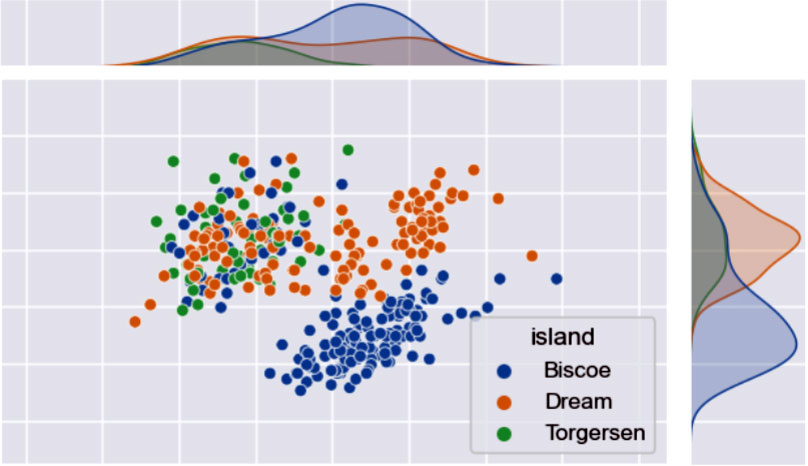
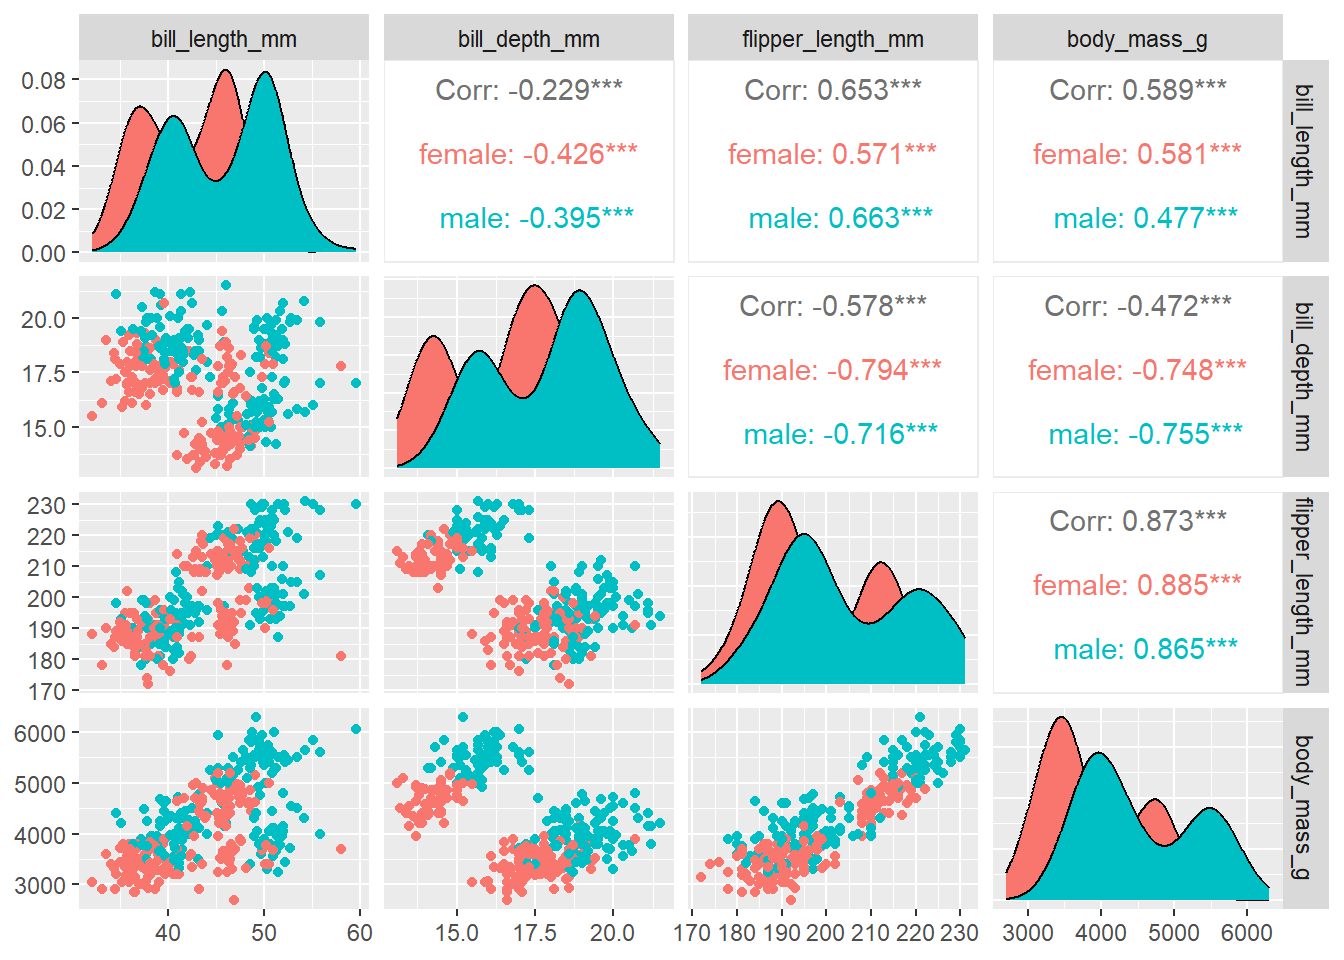
plotting in Python with Seaborn: Joint plot
Analysis
Visualization
Python
In Visualization with Seaborn of this series, we were introduced on the power visualization and dove into…
February 22, 2023
Masumbuko Semba
2 min
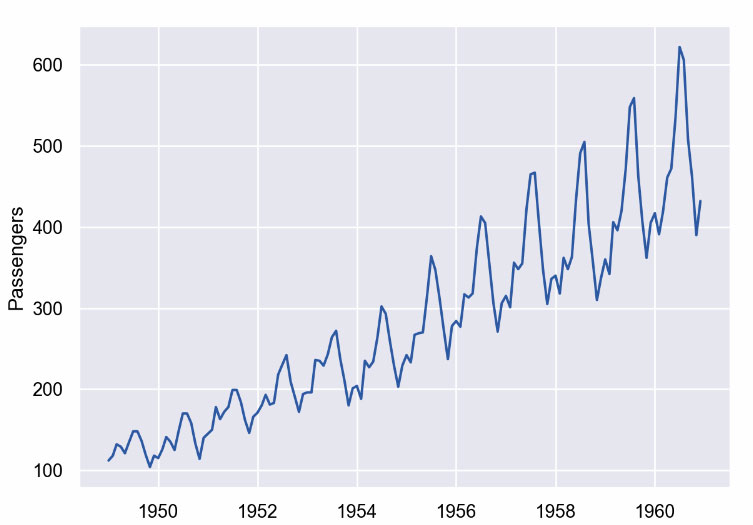
plotting in Python with Seaborn: Line plot
Analysis
Visualization
Python
In visualization with Seaborn of this series, we were introduced on the power visualization and dove into…
February 22, 2023
Masumbuko Semba
4 min
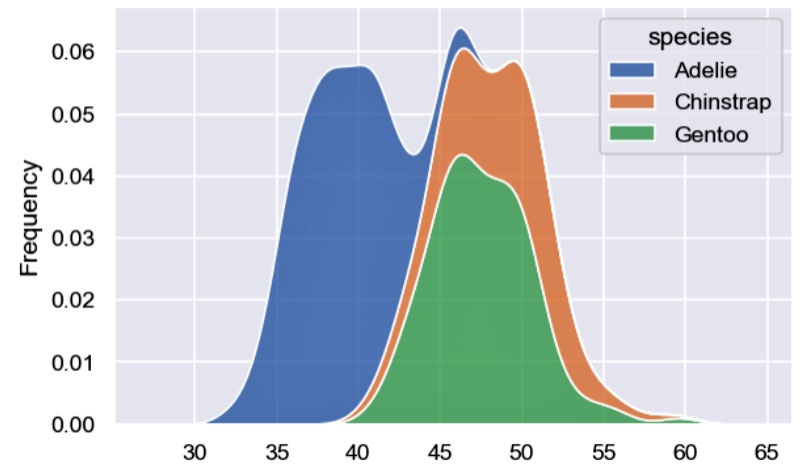
plotting in Python with Seaborn: Distribution plot
Analysis
Visualization
Python
Wikipedia
(2023)
describe data visualization as an interdisciplinary field that deals with the graphic representation…
February 21, 2023
Masumbuko Semba
5 min
Multi-lingual: R and Python for Data Science
Analysis
Visualization
If you work with data science,
R
and
Python
must be the two programming languages that you use the most. Both
R
and
Pyt…
February 20, 2023
Masumbuko Semba
6 min
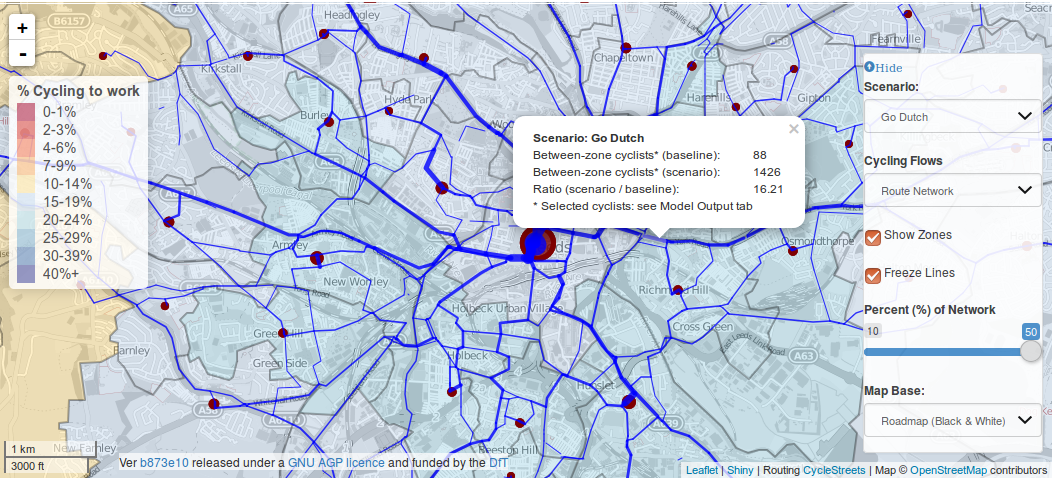
Main and Inset maps with R
Analysis
Visualization
In this post, We learn how we can make publication quality inset maps in R using
ggplot2
package
(Wickham 2016)
. When…
February 19, 2023
Masumbuko Semba
9 min
Inferential statistics in R:ttest
Analysis
Visualization
A formal statistical test called a hypothesis test is used to confirm or disprove a statistical hypothesis. The…
February 15, 2023
Masumbuko Semba
6 min
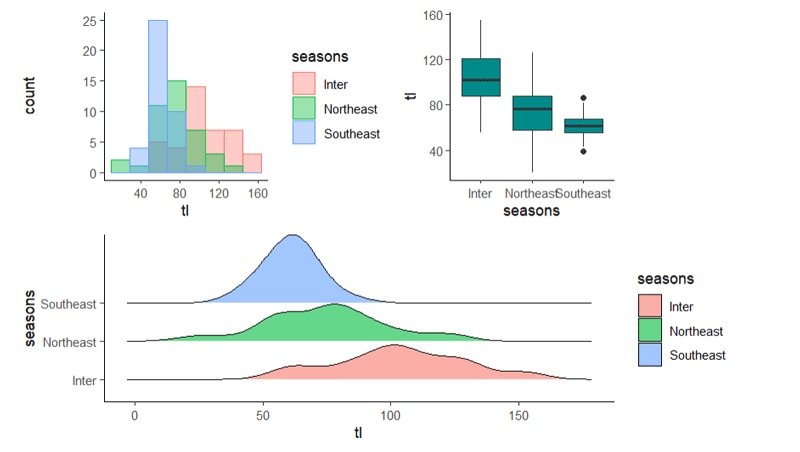
Combining plots in R
Analysis
Visualization
The ggplot2 package doesn’t provide a function to arrange multiple plots in a single figure
(Wickham 2016)
. Still…
February 4, 2023
Masumbuko Semba, Nyamisi Peter
4 min
Manipulating Simple features: point to polyline
Manipulation
Visualization
R
In this post we are going to learn one of the key skills that one dealing with spatial data need to know. That’s is…
December 1, 2022
Masumbuko Semba
6 min
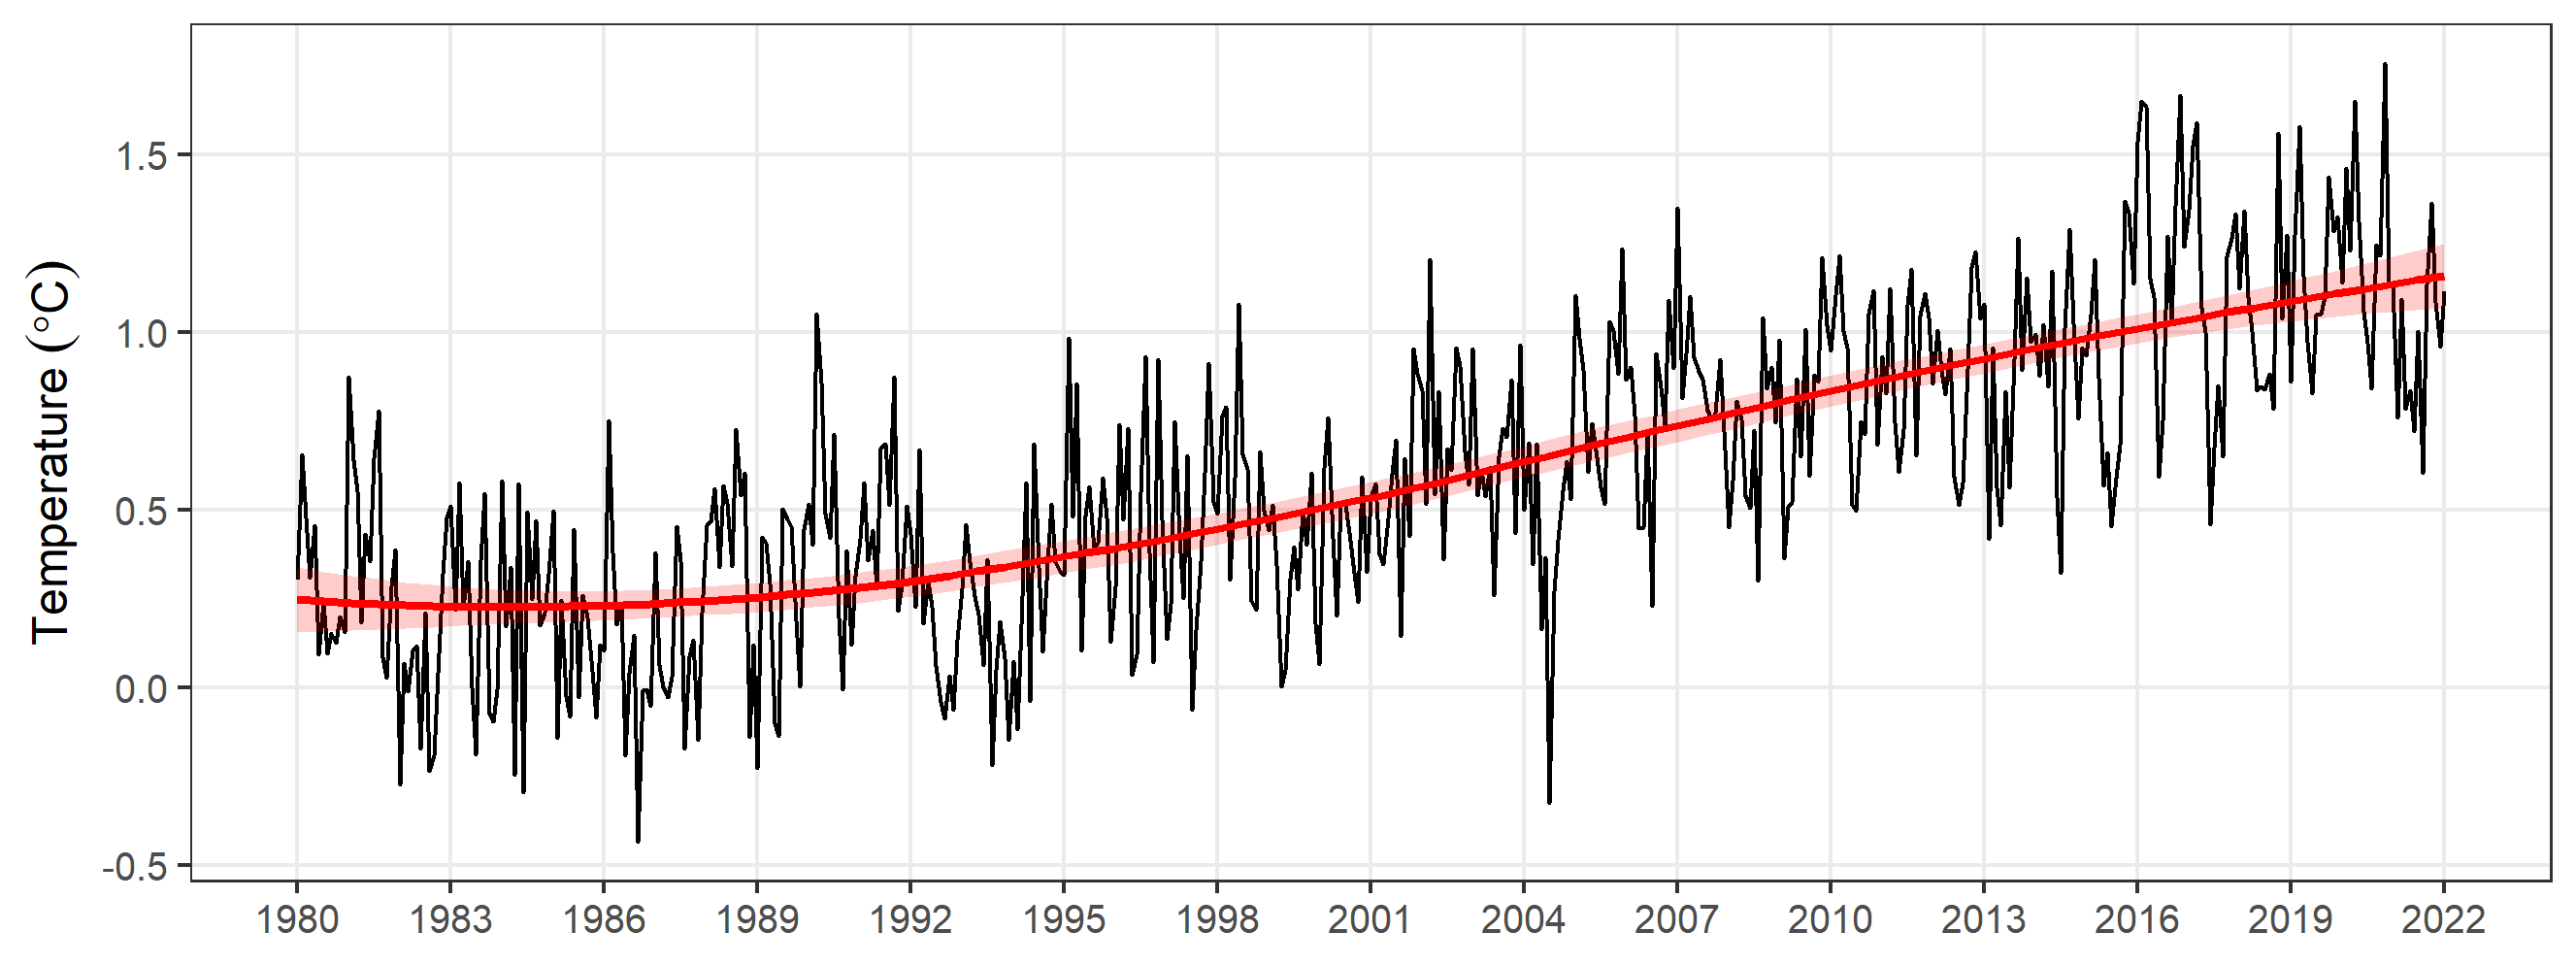
Forecasting Rising Temperature with prophet package in R
code
Analysis
Spatial
Time-series analysis aims to analyse and learn the temporal behavior of datasets over a period. Examples include the…
August 13, 2022
Masumbuko Semba
8 min
Teacher’s Employment Allocations by LGA
Visualization
Analysis
On April, 2022, the government of the United Republic of Tanzania approved permission of TAMISEMI to recruit and…
August 11, 2022
Masjumbuko Semba
12 min
Spatial Data is Maturing in R
Analysis
Spatial
Visualization
R is particularly powerful for spatial statistical analysis and quantitative researchers in particular may find R more…
August 8, 2022
Masjumbuko Semba
5 min
Getting and Processing Satellite Data Made Easier in R
Analysis
Visualization
Python
The amount of data being generated by satellites has soared in recent years. The proliferation of remote sensing data…
September 18, 2018
Masumbuko Semba
13 min
No matching items