
Will Your Data Science Programming Skills Be Replaced with Artificail Intelligence?
R
Modelling
In recent years, the rise of artificial intelligence (AI) and machine learning (ML) has led to the development of chatbots like chatGPT (Rodriguez, 2023), which can simulate human conversation. These chatbots are now being used in various industries to improve customer service, automate tasks, and even provide medical advice. However, as chatbots become more advanced, some people are asking whether they could replace human data scientists. In this blog post, we will explore this question and examine the potential benefits and drawbacks of using chatbots in data science.
Data science is the field of study that involves extracting insights and knowledge from data. Data scientists use various techniques, such as statistical analysis, machine learning, and data visualization, to analyze large datasets and identify patterns and trends. Data science is used in many industries, including healthcare, finance, and marketing, to make data-driven decisions and improve business outcomes.
Wikipedia define chatbot as a computer program that uses natural language processing (NLP) to simulate human conversation (Wikipedia contributors, 2023). Chatbots can be designed to perform various tasks, such as answering customer queries, providing recommendations, or even assisting with medical diagnoses. Some chatbots are rule-based, which means they follow a predefined set of rules to respond to user input. Others are powered by AI and ML algorithms, which enable them to learn from user interactions and improve their responses over time.
Returning to the fundamental question, Can Artificial Intelligence Replace Data Science Programming Skills? This crucial question has a clear answer–Not Always! While chatbots can be useful tools for data analysis and decision-making, they cannot replace the expertise and experience of a human data scientist.
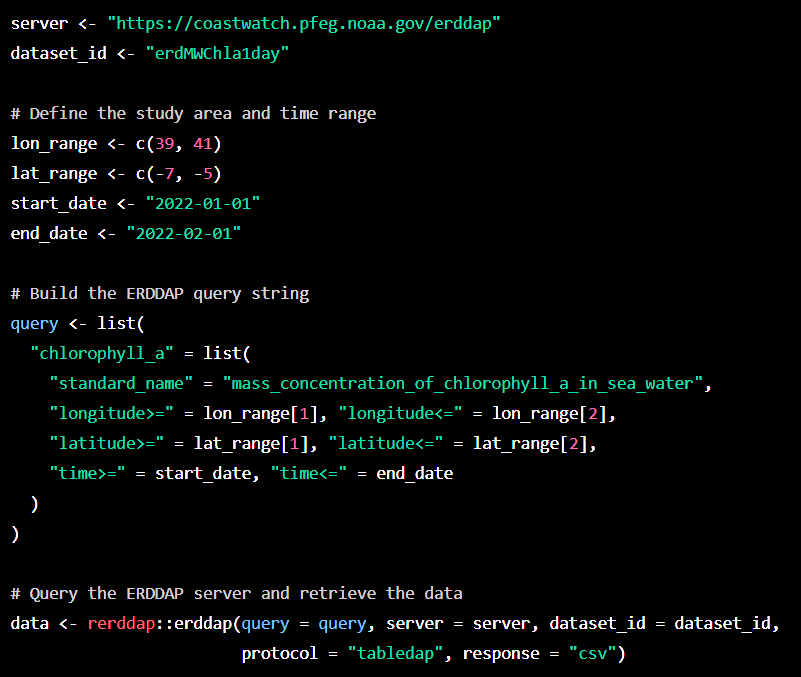
The GPT-3 AI language-generating system for example is the offspring of GPT-2, the world most harzadous AI. GPT-3 touts the ability to code in a variety of languages such as Cascading Style sheets (CSS), hypertext Markup language (HTML), Python, R, etc, it still has several issues that need to be fixed. Among them is that the code that GPT-3 generates might not be of much use. Also it makes mistakes that are challenging for inexperienced data scientists and beginners. For example, I was chatting with chatGPT and asked it to generate R codes to download chlorophyll-a acquired with MODIS sensor for the Pemba Channel.
It did wonderful job. As plainly seen in Figure 1, it first loaded the rerddap package and defined the ERDDAP server URL and the dataset ID for the MODIS Aqua Chlorophyll-a Level 3 dataset. It then defined the study area and time range by specifying longitude and latitude ranges, and start and end dates. It built the ERDDAP query string by specifying the variable name, standard name, and the desired ranges for longitude, latitude, and time.Then used the erddap function from the rerddap package to query the ERDDAP server and retrieve the data. The data is returned as a data frame in CSV format.
I copied the code chunk from ChatGPT snippet (Figure 1) and paste it in the chunk below:
library(rerddap)

# Define the ERDDAP server URL and dataset ID
server <- "https://coastwatch.pfeg.noaa.gov/erddap"
dataset_id <- "erdMWChla1day"

# Define the study area and time range
lon_range <- c(39, 41)
lat_range <- c(-7, -5)
start_date <- "2022-01-01"
end_date <- "2022-02-01"

# Build the ERDDAP query string
query <- list(
  "chlorophyll_a" = list(
    "standard_name" = "mass_concentration_of_chlorophyll_a_in_sea_water",
    "longitude>=" = lon_range[1], "longitude<=" = lon_range[2],
    "latitude>=" = lat_range[1], "latitude<=" = lat_range[2],
    "time>=" = start_date, "time<=" = end_date
  )
)

# Query the ERDDAP server and retrieve the data
data <- rerddap::erddap(query = query, server = server, dataset_id = dataset_id,
                        protocol = "tabledap", response = "csv")
Despite the detailed explanation of chatGPT provided, when the chunk is exuted, it resulted into an error message stating that Error: ‘erddap’ is not an exported object from ‘namespace:rerddap’. It failed miserable because the erddap function used in line 24 of the chunk code above is not part of the erddap package. Therefore, as it has been emphasized, inaccurate information and lines of codes is a common mistake we expect from these kind of tools, and the essence of expert to support the error is paramount. Therefore, the code chunk below provide a correct functions and lines of code that answer the question posted in the chatGPT.
library(rerddap)
library(tidyverse)

chl = rerddap::griddap(
  x = "erdMH1chla8day",
  longitude = c(38, 39.5),
  latitude = c(-6.5,-5.5),
  time = c("2022-01-01", "2022-01-31"),
  fmt = "csv") %>%
    dplyr::as_tibble() %>%
    dplyr::mutate(time = lubridate::as_date(time))

chl
# A tibble: 4,625 x 4
time latitude longitude chlorophyll
<date> <dbl> <dbl> <dbl>
1 2021-12-31 -5.48 38.0 NaN
2 2021-12-31 -5.48 38.0 NaN
3 2021-12-31 -5.48 38.1 NaN
4 2021-12-31 -5.48 38.1 NaN
5 2021-12-31 -5.48 38.1 NaN
6 2021-12-31 -5.48 38.2 NaN
7 2021-12-31 -5.48 38.2 NaN
8 2021-12-31 -5.48 38.3 NaN
9 2021-12-31 -5.48 38.3 NaN
10 2021-12-31 -5.48 38.4 NaN
# ... with 4,615 more rowsI then used the ggplot2 package (Campitelli, 2019; Wickham, 2016) to visualize the distribution of chlorophyll-a in the Pemba Channel. I specified the longitude and latitude values from the data frame, and used the z parameter to specify the chlorophyll-a values for each pixel in the plot. I also specified a color scale for the plot using the scale_fill_gradientn function and separated plots for each date of the year with The facet_wrap() function. The labs() function was used to add a title and axis labels to faceted plots.
ggplot(
  data = chl %>% filter(time < "2022-01-16"),
  aes(x = longitude, y = latitude, z = chlorophyll)
  )+
  metR::geom_contour_fill(bins = 120)+
  metR::geom_contour2(aes(label = ..level..)) +
  ggspatial::layer_spatial(tz, fill = "#84837a", color = "black", linewidth = .5)+
  scale_fill_gradientn(colours = oce::oce.colors9A(120), trans = scales::log10_trans(),
                       name = "Chl-a\n(mgm^3)")+
  metR::scale_x_longitude(ticks = .3)+
  metR::scale_y_latitude(ticks = .3) +
 coord_sf(xlim = c(38.7,39.4), ylim = c(-6.5,-5.5))+
  facet_wrap(~time, nrow = 1) +
  theme_bw()+
  theme(strip.background = element_rect(fill = "white"))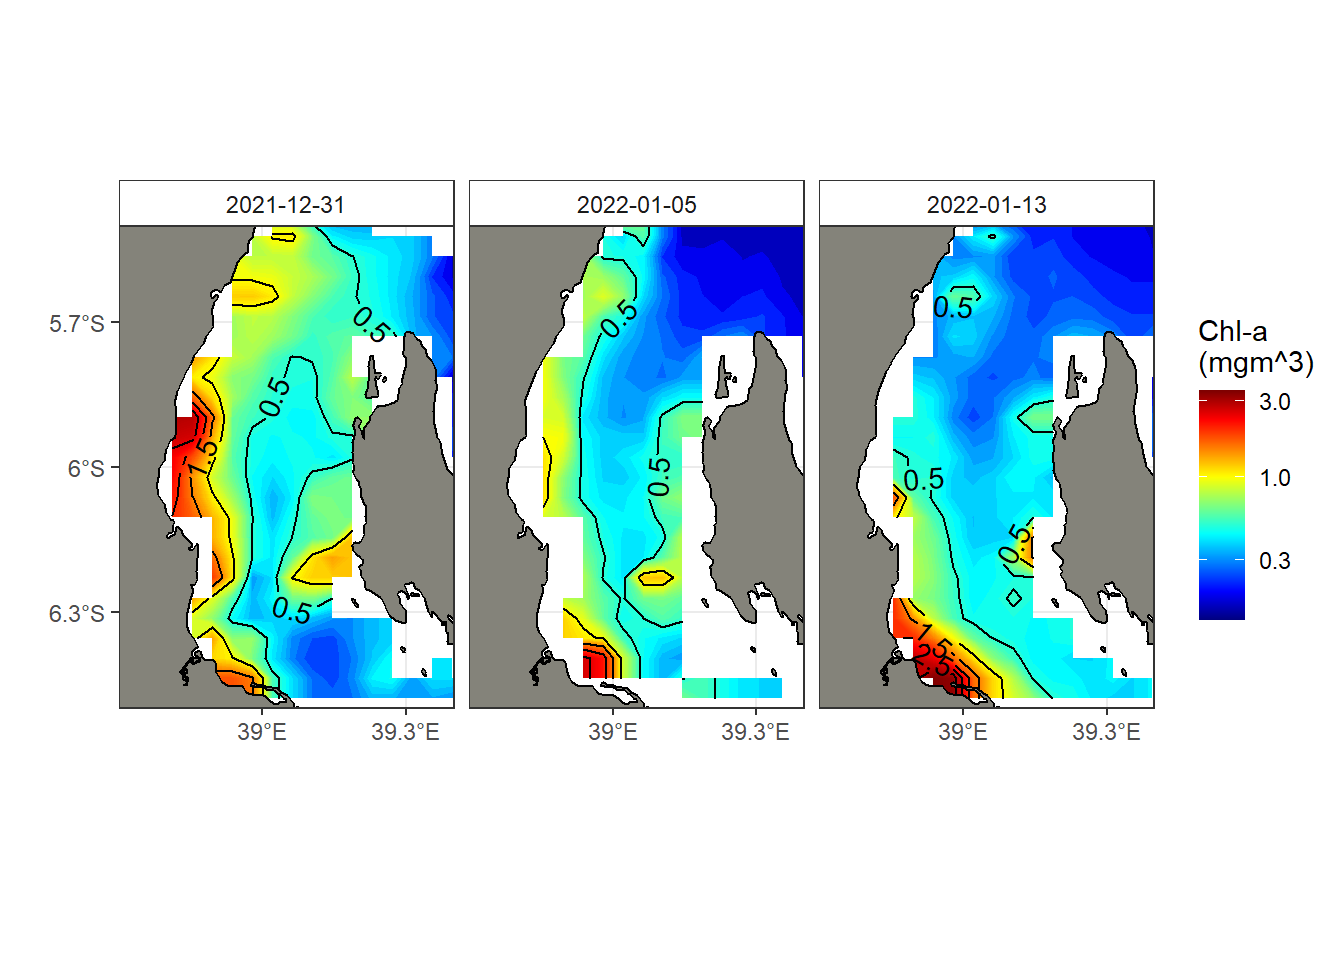
In summary, although there existing chatbots like ChatGPT that can generate simple code, they cannot decide which feature should be prioritized or what issues that algorithm or piece of code should address. While chatbots like ChatGPT can be useful tools for data analysis and decision-making, they cannot replace the expertise and experience of a human data scientist. Chatbots are limited by their programming and lack the domain knowledge, creativity, and human interaction required for complex data science tasks. However, chatbots can provide some benefits, such as improved efficiency, faster response times, scalability, and a user-friendly interface. For the time being, only a smart data scientist can create code based on an understanding of precise requirements and specification of the data related issue that need to bring business solution.
Cited sources
Campitelli, E., 2019. metR: Tools for easier analysis of meteorological fields.
Rodriguez, J.C., 2023. Chatgpt: Interface to ’ChatGPT’ from r.
Wickham, H., 2016. ggplot2: Elegant graphics for data analysis. Springer-Verlag New York.
Wikipedia contributors, 2023. Chatbot — Wikipedia, the free encyclopedia.