Chapter 4 Importing data with readr
As statisticians or data analysts we need to collect data from many sources. We then need to tame it and bring it into a useful format which we control. This section will prepare you to get started with data wrangling!
4.1 Getting Data into R
Much of the data we download or receive from researchers is in the form of delimited files. Whether that be a comma separated (csv) or a tab delimited file, there are multiple functions that can read these data into R. We will stick to loading these data from the tidyverse packages but be aware these are not the only methods for doing this. We will use the tidyverse functions just to maintain consistency with everything else we do.
The first package in tidyverse we will use is called readr (Wickham and Hester 2020), which is a collection of functions to load the tabular data from working directory in our machine into R session. Some of its functions include:
read_csv(): comma separated (CSV) filesread_tsv(): tab separated filesread_delim(): general delimited filesread_fwf(): fixed width filesread_table(): tabular files where columns are separated by white-space.read_log(): web log files- readxl reads in Excel files.
You can lean R with the dataset it comes with when you install it in your machine. But sometimes you want to use the real data you or someone gathered already. One of critical steps for data processing is to import data with special format into R workspace.Data import refers to read data from the working directory into the workspace (Wickham and Hester 2020). In this chapter you will learn how to import common files into R. We will only focus on two common types of tabular data storage format—The comma-seprated .csv and excell spreadsheet (.xlsx). In later chapter we will explain how to read other types of data into R.
4.2 Comma-Separated (.csv)
The most commonly format that R like is the comma-separated files. Although Base R provides various functions like read.table(), read.csv(), read.table() and read.csv2() to import data from the local directories into R workspace, for this book we use an read_csv() function from readr. Before we import the data, we need to load the packages that we will use their functions in this chapter
require(dplyr)
require(readr)
require(lubridate)
require(readxl)
require(haven)
require(ggplot2)
require(kableExtra)
Consider a tabular data stored in my working directory in the .csv format in figure 4.1.
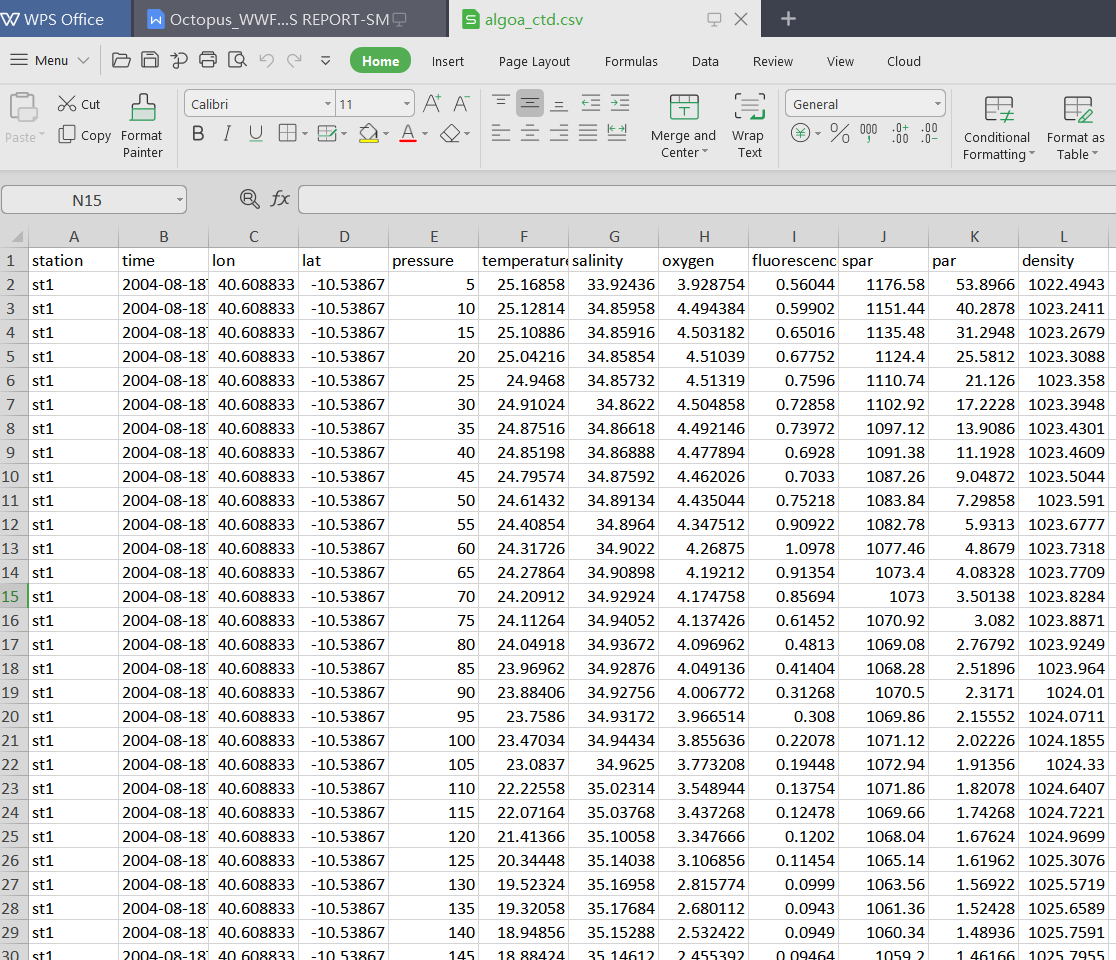
Figure 4.1: A screenshot of the sample dataset
We can import it with the read_csv() functions as:
-- Column specification ------------------------------
cols(
  station = col_character(),
  time = col_datetime(format = ""),
  lon = col_double(),
  lat = col_double(),
  pressure = col_double(),
  temperature = col_double(),
  salinity = col_double(),
  oxygen = col_double(),
  fluorescence = col_double(),
  spar = col_double(),
  par = col_double(),
  density = col_double()
)
When read_csv() has imported the data into R workspace, it prints out the name and type of of data for each variable.
By simply glimpse the dataset, we see the format of the data is as expected. It has six variables(columns) and 177 observations (rows) similar to figure 4.1. Table 4.1 show sample of imported dataset.
| Station | Time | Lon | Lat | Pressure | Temperature | Salinity | Oxygen | Fluorescence |
|---|---|---|---|---|---|---|---|---|
| st1 | 2004-08-18 | 40.61 | -10.54 | 5 | 25.17 | 33.92 | 3.93 | 0.56 |
| st1 | 2004-08-18 | 40.61 | -10.54 | 10 | 25.13 | 34.86 | 4.49 | 0.60 |
| st1 | 2004-08-18 | 40.61 | -10.54 | 15 | 25.11 | 34.86 | 4.50 | 0.65 |
| st1 | 2004-08-18 | 40.61 | -10.54 | 20 | 25.04 | 34.86 | 4.51 | 0.68 |
| st1 | 2004-08-18 | 40.61 | -10.54 | 25 | 24.95 | 34.86 | 4.51 | 0.76 |
| st1 | 2004-08-18 | 40.61 | -10.54 | 30 | 24.91 | 34.86 | 4.50 | 0.73 |
| st1 | 2004-08-18 | 40.61 | -10.54 | 35 | 24.88 | 34.87 | 4.49 | 0.74 |
| st1 | 2004-08-18 | 40.61 | -10.54 | 40 | 24.85 | 34.87 | 4.48 | 0.69 |
| st1 | 2004-08-18 | 40.61 | -10.54 | 45 | 24.80 | 34.88 | 4.46 | 0.70 |
| st1 | 2004-08-18 | 40.61 | -10.54 | 50 | 24.61 | 34.89 | 4.44 | 0.75 |
4.3 Microsoft Excel(.xlsx)
Commonly our data is stored as a MS Excel file. we can import the file with read_xlsx() function of readxl package. The readxl package provides a function read_exel() that allows us to specify which sheet within the Excel file to read and what character specifies missing data (it assumes a blank cell is missing data if you don’t specifying anything). The function automatically convert the worksheet into a .csv file and read it. Let’s us import the the data in first sheet of the primary_productivity.xlsx. The dataset contain primary productivity value. We will use this file to illustrate how to import the excel file into R workspace with readxl package (Wickham and Bryan 2019).
# A tibble: 5 x 3
  DateTime            `MODIS 1 Month ~
  <dttm>                         <dbl>
1 2016-06-01 00:00:00             2014
2 2016-12-01 00:00:00             2016
3 2016-01-01 00:00:00             2015
4 2016-02-01 00:00:00             2003
5 2016-11-01 00:00:00             2018
# ... with 1 more variable: `MODIS 1 Month PP
#   (value)` <dbl>
By printing the sheet1, we notice that the sheet contains monthly average value of primary productivity from the Pemba channel.
# A tibble: 5 x 3
  DateTime            `MODIS 1 Month ~
  <dttm>                         <dbl>
1 2016-06-01 00:00:00             2012
2 2016-12-01 00:00:00             2005
3 2016-08-01 00:00:00             2017
4 2016-12-01 00:00:00             2003
5 2016-06-01 00:00:00             2011
# ... with 1 more variable: `MODIS 1 Month PP
#   (value)` <dbl>
sheet2 contains monthly average value of primary productivity from the Zanzibar channel.
# A tibble: 5 x 3
  DateTime            `MODIS 1 Month ~
  <dttm>                         <dbl>
1 2016-12-01 00:00:00             2012
2 2016-04-01 00:00:00             2018
3 2016-06-01 00:00:00             2013
4 2016-01-01 00:00:00             2015
5 2016-09-01 00:00:00             2004
# ... with 1 more variable: `MODIS 1 Month PP
#   (value)` <dbl>
sheet3 contains monthly average value of primary productivity from the Mafia channel.
We look on the internal structure of the sheet3 file with the glimpse() function. You can interact with the table that show all variables and observations (Table ??)
Rows: 192
Columns: 3
$ DateTime                   <dttm> 2016-01-01, 2...
$ `MODIS 1 Month PP (y)`     <dbl> 2003, 2004, 20...
$ `MODIS 1 Month PP (value)` <dbl> 1311.5010, 106...4.4 Writing t a File
Sometimes you work in the document and you want to export to a file. readr has
write_csv() and write_tsv() functions that allows to export data frames from workspace to working directory
Wickham and Bryan (2019) recommend the use of write_excel_csv() function when you want to export a data frame to Excel. readr has other tools that export files to other software like SAS, SPSS and more …
4.5 Basic Data Manipulation
In this section, we briefly introduce some basic data handling and manipulation techniques, which are mostly associated with data frame. A data frame is a a tabular shaped contains columns and rows of equal length. In general a data frame structure with rows representing observations or measurements and with columns containing variables.
4.5.1 Explore the Data Frame
We can visualize the table by simply run the name of the data flights
we can use class() to check if the data is data frame
[1] "spec_tbl_df" "tbl_df"      "tbl"
[4] "data.frame"
We can use names() to extract the variable names
 [1] "date"    "village" "port"    "ground"  "sex"
 [6] "dml"     "tl"      "weight"  "lat"     "lon"
We can explore the internal structure of flights object with a dplyr()’s function glimpse()
Rows: 1,079
Columns: 10
$ date    <date> 2018-02-12, 2018-01-30, 2018-02-...
$ village <chr> "Somanga", "Bwejuu", "Somanga", "...
$ port    <chr> "Mbuyuni", "Kusini", "Mbuyuni", "...
$ ground  <chr> "CHAMBA CHA MACHANGE", "NYAMALILE...
$ sex     <chr> "F", "M", "M", "M", "M", "F", "M"...
$ dml     <dbl> 14.0, 14.5, 17.0, 20.0, 12.0, 16....
$ tl      <dbl> 110.0, 115.0, 115.0, 130.0, 68.0,...
$ weight  <dbl> 1.385, 1.750, 1.000, 2.601, 0.670...
$ lat     <dbl> -8.397838, -7.915809, -8.392644, ...
$ lon     <dbl> 39.28079, 39.65424, 39.28153, 39....
We can check how rows (observations/measurements) and columns (variables/fields) are in the data
[1] 1079 10The number of rows (observation) can be obtained using nrow() function
[1] 1079The number of columns (variables) can be obtained using ncol() function
[1] 10The length of the data frame is given by
[1] 10Count the number of sample at each sex of octopus
sex
  F   M
581 498
Count the number and compute the proportion of sample at each sex of octopus
sex
   F    M
0.54 0.46
4.5.2 simmple summary statistics
The most helpful function for for summarizing rows and columns is summary(), which gives a collection of basim cummary statistics. The first method is to calculate some basic summary statistics (minimum, 25th, 50th, 75th percentiles, maximum and mean) of each column. If a column is categorical, the summary function will return the number of observations in each category.
      date              village
 Min.   :2017-12-18   Length:1079
 1st Qu.:2018-01-14   Class :character
 Median :2018-01-20   Mode  :character
 Mean   :2018-01-26
 3rd Qu.:2018-02-15
 Max.   :2018-03-12
     port              ground
 Length:1079        Length:1079
 Class :character   Class :character
 Mode  :character   Mode  :character


     sex                 dml             tl
 Length:1079        Min.   : 6.0   Min.   : 11.00
 Class :character   1st Qu.:10.0   1st Qu.: 68.00
 Mode  :character   Median :12.0   Median : 82.00
                    Mean   :12.8   Mean   : 86.01
                    3rd Qu.:15.0   3rd Qu.:100.00
                    Max.   :24.0   Max.   :180.00
     weight           lat              lon
 Min.   :0.055   Min.   :-8.904   Min.   : 0.00
 1st Qu.:0.600   1st Qu.:-8.523   1st Qu.:39.28
 Median :0.915   Median :-8.392   Median :39.50
 Mean   :1.232   Mean   :-8.069   Mean   :38.69
 3rd Qu.:1.577   3rd Qu.:-7.973   3rd Qu.:39.67
 Max.   :5.210   Max.   : 0.000   Max.   :39.75
You noticed that the summary() function provide the common metric for central tendency and measure of dispersion. We will look at them later. Now we turn to our favourite package dplyr
References
Wickham, Hadley, and Jennifer Bryan. 2019. Readxl: Read Excel Files. https://CRAN.R-project.org/package=readxl.
Wickham, Hadley, and Jim Hester. 2020. Readr: Read Rectangular Text Data. https://CRAN.R-project.org/package=readr.