Chapter 1 Introduction to GIS
1.1 Learning Objectives
After finishing this chapter, you should be able to:
- Understand what stands for GIS and explain what is GIS
- Understand the commercial and open source software used in GIS
- Distinguish between desktop application and R programming
- Understand what are packages and how useful they are in R
1.2 What is a GIS
This is probably the most asked question posed to those in the Geographic Information Systems (GIS) field and is probably the hardest to answer in a succinct and clear manner. GIS is a technological field that incorporates geographical features with tabular data in order to map, analyze, and assess real-world problems. Bolstad (2016) describes a geographic information system as a computer framework of hardware and software for gathering, managing, analyzing and displaying geographically referenced data
Rooted in the science of geography, GIS integrates many types of data. It analyzes spatial location and organizes layers of information into visualizations using maps. With this unique capability, GIS reveals deeper insights into data, such as patterns, relationships, and situations—helping users make smarter decisions.
It’s important to note that most datasets you will encounter in your lifetime can all be assigned a spatial location. So in essence, any dataset can be represented in a GIS: the question then becomes “does it need to be analyzed in a GIS environment?” The answer to this question depends on the purpose of the analysis. If, for example, we are interested in identifying the countries in the Africa with highest capture fisheries catches reported to FAO in 2018, a simple table listing those catches by country is all that is needed (Table 1.1).
| Country | Fish Catches (MT) |
|---|---|
| Morocco | 1386548 |
| Mauritania | 967707 |
| Nigeria | 878155 |
| South Africa | 570545 |
| Namibia | 490149 |
| Senegal | 484750 |
| Angola | 442255 |
| Uganda | 439354 |
| Ghana | 376767 |
| Tanzania | 375755 |
However, if we are interested to know whether countries with a high catches are geographically clustered, does information in table 1.1 provide us with enough information to help answer this question? The answer is simple NO. We need geographical information data that link location and shape of each country with fisheries catch. A map similar to figure 1.1 that shows the variation of fisheries catch in space would be helpful.
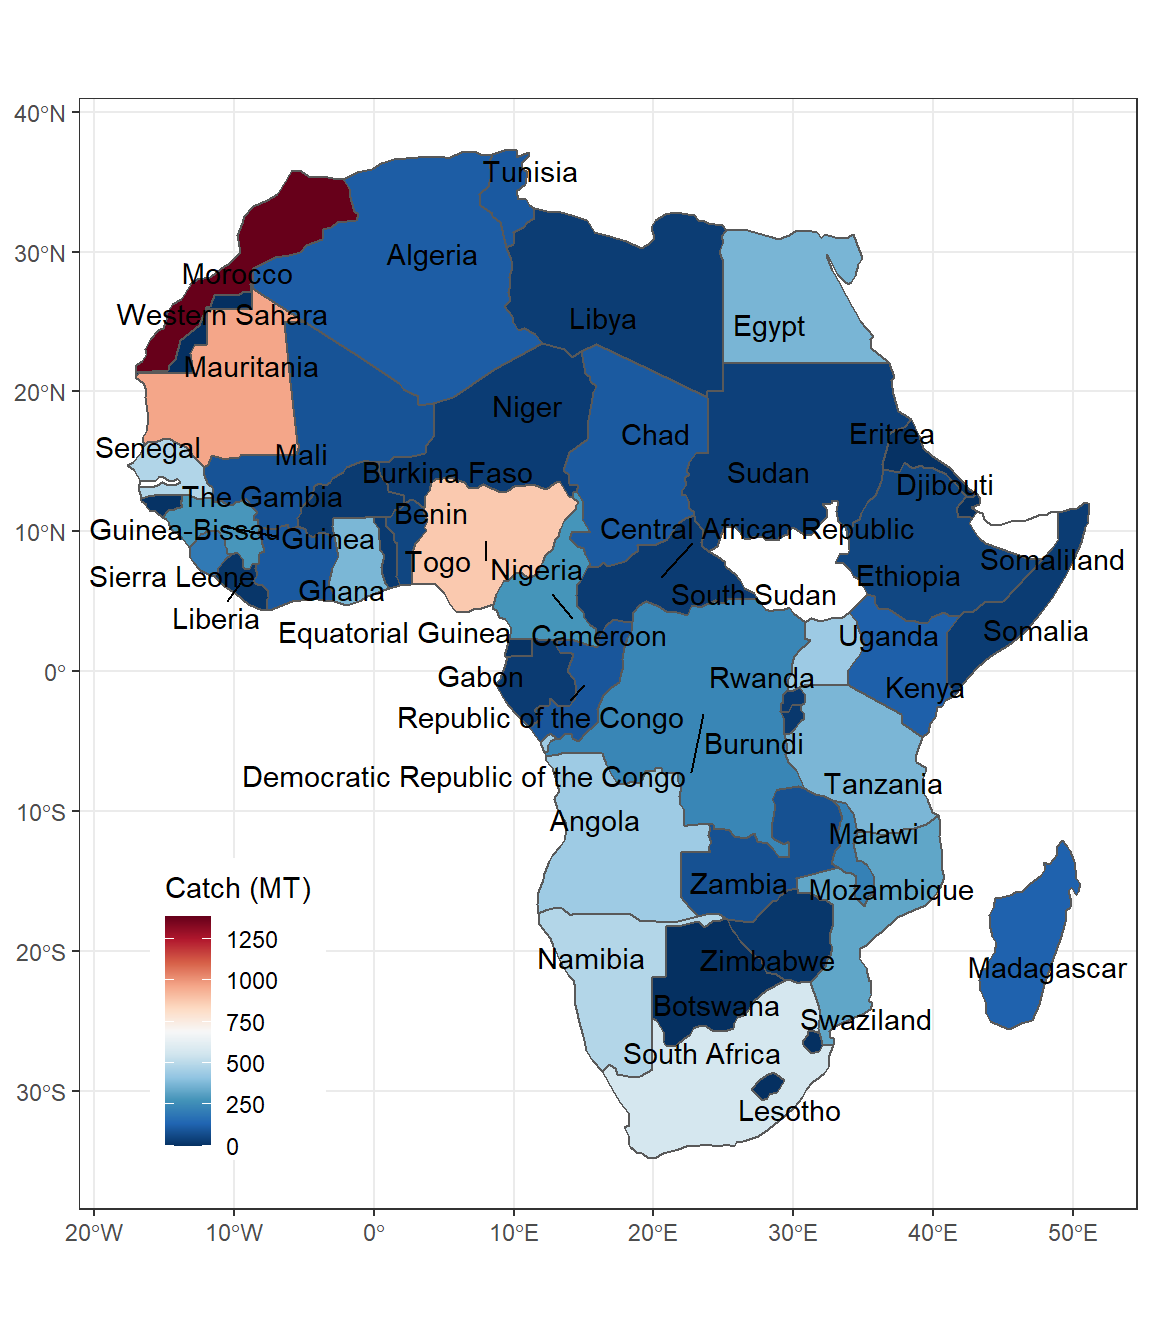
Figure 1.1: A static Choropleth representation of African spatial distribution of capture fisheries reported to FAO in 2018
Figure 1.2: An interactive Choropleth representation of African spatial distribution of capture fisheries reported to FAO in 2018
Maps are ubiquitous—available online and in various print medium. But we seldom ask how the boundaries of the map features are encoded in a computing environment? After all, if we expect software to assist us in the analysis, the spatial elements of our data should be readily accessible in a digital form. Spending a few minutes thinking through this question will make you realize that simple tables or spreadsheets are not up to this task. A more complex data storage mechanism is required. This is the core of a GIS environment: a spatial database that facilitates the storage and retrieval of data that define the spatial boundaries, lines or points of the entities we are studying. This may seem trivial, but without a spatial database, most spatial data exploration and analysis would not be possible!
1.3 GIS software
GIS provides a powerful environment for analysis of spatially-referenced data. The most widely used GIS applications in research are “desktop” software products with graphical user interfaces designed for interactive use. Two popular applications are ArcGIS and QGIS.
1.3.1 ArcGIS
A popular commercial GIS software is ArcGIS developed by ESRI (ESRI),was once a small land-use consulting firm which did not start developing GIS software until the mid 1970s. The ArcGIS desktop environment encompasses a suite of applications which include ArcMap, ArcCatalog, ArcScene and ArcGlobe. ArcGIS comes in three different license levels (basic, standard and advanced) and can be purchased with additional add-on packages. As such, a single license can range from a few thousand dollars to well over ten thousand dollars. In addition to software licensing costs, ArcGIS is only available for Windows operating systems; so if your workplace is a Mac only environment, the purchase of a Windows PC would add to the expense.
1.3.2 QGIS
A very capable open source (free) GIS software is QGIS. It encompasses most of the functionality included in ArcGIS. If you are looking for a GIS application for your Mac or Linux environment, QGIS is a wonderful choice given its multi-platform support. Built into the current versions of QGIS are functions from another open source software: GRASS. GRASS has been around since the 1980’s and has many advanced GIS data manipulation functions however, its use is not as intuitive as that of QGIS or ArcGIS (hence the preferred QGIS alternative).
These desktop applications (ArcMap, QGIS) are wonderful tools for exploratory data analysis and map production. However, in research they introduce the problem that much of the results of even fairly simple analytic work flows are not reproducible because the software is generally not designed to record all of the analytical processes the user performed. This is particularly salient during development of analytic methods, during which a substantial amount of trial-and-error occurs.
1.3.3 R
The computer language we will be using in this book is R. The open–source computer language R was developed mainly to address statistical computing, nevertheless, pretty much anything can be carried out in R like creating website, publishing books, editing photos, marking plots and maps. R is one of the popular computer languages among scientist.
In recent years, R’s spatial capabilities have increased rapidly with the development of dozens of packages dedicated for spatial analysis and hundreds of proven applications in academic research and industry. With the aid of editors like Rstudio, R is also now more accessible than ever before. Approaching GIS analysis within an R framework addresses many of the problem encountered when using desktop GIS software:
- Geoprocessing operations that are performed with programmatic code are reproducible. While ArcGIS and QGIS include Python for programmatic approaches, many researchers are already working with R, so only some new commands need to be learned, rather than an entire new language.
- R is a language that is relatively easy to read and write, lowering the bar for entry.
- R results are generally stored as data frames which can then be used by the many analytic functions in base R or in added packages.
- Geoprocessing operations produce results that are stored in memory. This will be a problem for very large data sets and/or limited RAM. On the other hand, it does not force the analyst to decide the file system location and name of a data set at run time; code can be altered to store file system outputs after work flows are determined to have created correct results. . Files created using programmatic code can be traced back to the code that generated them (i.e., find / -name "*.R" | xargs grep “myawesomedataset.gpkg”).
- Incorporating GIS analyses in R Markdown allows the analyst to create reports that include both the analytic code used to create results as well as to show results and even maps.
In this book, we provide an argument for increased understanding and use of R as a command line application for applied GIS and demonstrate how it can be used to effortlessly undertake advanced spatial modelling and analysis and visualization within a cohesive environment.
We can install R from the link https://cloud.r-project.org and download and install R based on your computer system.
1.3.4 Why R?
Unlike most other GIS software designed specifically for mapping, R is free and open source, powerful, flexible, and relevant beyond the mapping coastal and marine features. Arguments against using and teaching R generally cluster around the following two points: teaching programming in addition to spatial statistic concepts is challenging and the command line is more intimidating to beginners than the graphical user interface (GUI) most point-and-click type software offer.
One solution for these concerns is to avoid hands-on data analysis completely. If we do not ask our students to start with raw data and instead always provide them with small, tidy rectangles of data then there is never really a need for software beyond spreadsheet or graphing calculator. This is not what we want in a modern GIS analysis and is a disservice to students.
Another solution is to use traditional point-and-click software for data analysis. The typical argument is that the GUI is easier for students to learn and so they can spend more time on concepts. However, this ignores the fact that these software tools also have nontrivial learning curves. In fact, teaching specific data analysis tasks using such software often requires lengthy step-by-step instructions, with annotated screenshots, for navigating menus and other interface elements. Also, it is not uncommon that instructions for one task do not easily extend to another. Replacing such instructions with just a few lines of R code actually makes the instructional materials more concise and less intimidating.
Many in the spatial analysis community are in favor of teaching R (or some other programming language, like Python), however the value of using R in introductory statistics courses is not as widely accepted. We acknowledge that this addition can be burdensome, however we would argue that learning a tool that is applicable beyond the introductory spatial statistics course and that enhances students’ problem solving skills is a burden worth bearing.
1.3.5 Rstudio
Rstudio is a platform that facilitates how we import, tidy, manipulate, model and visualize data in R. We can install Rstudio from its weblink https://www.rstuidio.com and download the installation file based on your computer.
1.3.6 Why RStudio?
The RStudio IDE includes a viewable environment, a file browser, data viewer, and a plotting pane, which makes it less intimidating than the bare R shell. Additionally, since it is a full fledged IDE, it also features integrated help, syntax highlighting, and context-aware tab completion, which are all powerful tools that help flatten the learning curve. RStudio also has direct integration with other critically important tools for teaching computing best practices and reproducible research. Our recommendation is that students access the RStudio IDE and stop thinking about the console in base R. We recommend students to download and install R and Rstudio in their local machine.
1.3.7 Packages
Although the base installation of R has many functions and prograaming approaches to manipulate the data—cleaning and structuring data, we will use additional functions from packages in this book. Some of these packages include;
tidyverse—a package with a set of packages that facilitate data importing, manipulation, modelling and displaying results.
readxl—package to import Excel spreasheet file into R metR–
lubridate—
patchwork—
1.4 Communication of results
It is important to note that the goal of research is not merely to collect data for analysis, but to guide policy and decision makers with relevant information for proper and sustainable protection, utilization and management of aquatic resources. A key aspect of research is, therefore, the proper and timely dissemination of information to those responsible for management of aquatic resources.
The R software provides excellent tools that greatly facilitate effective communication of results (R Core Team 2020). R offers visualization packages such as leaflet (Cheng, Karambelkar, and Xie 2019), tmap (Tennekes 2018) and mapview (Appelhans et al. 2020) for making interactive maps, dygraphs (Vanderkam et al. 2018) for plotting time series, and DT (Xie, Cheng, and Tan 2020) for displaying data tables. Moreover, findings can be easily included in reproducible reports generated with R Markdown (Xie, Dervieux, and Riederer 2020), interactive dashboards using flexdashboard (Iannone, Allaire, and Borges 2020), and interactive web applications built with Shiny (Chang et al. 2020). These tools provide important information on which to base action and a careful interpretation of them allows coastal and marine resources officers to allocate resources efficiently and target populations for education or management programs.
References
Appelhans, Tim, Florian Detsch, Christoph Reudenbach, and Stefan Woellauer. 2020. Mapview: Interactive Viewing of Spatial Data in R. https://CRAN.R-project.org/package=mapview.
Bolstad, Paul. 2016. GIS Fundamentals: A First Text on Geographic Information Systems. Eider (PressMinnesota).
Chang, Winston, Joe Cheng, JJ Allaire, Yihui Xie, and Jonathan McPherson. 2020. Shiny: Web Application Framework for R. https://CRAN.R-project.org/package=shiny.
Cheng, Joe, Bhaskar Karambelkar, and Yihui Xie. 2019. Leaflet: Create Interactive Web Maps with the Javascript ’Leaflet’ Library. https://CRAN.R-project.org/package=leaflet.
Iannone, Richard, JJ Allaire, and Barbara Borges. 2020. Flexdashboard: R Markdown Format for Flexible Dashboards. https://CRAN.R-project.org/package=flexdashboard.
R Core Team. 2020. R: A Language and Environment for Statistical Computing. Vienna, Austria: R Foundation for Statistical Computing. https://www.R-project.org/.
Tennekes, Martijn. 2018. “tmap: Thematic Maps in R.” Journal of Statistical Software 84 (6): 1–39. https://doi.org/10.18637/jss.v084.i06.
Vanderkam, Dan, JJ Allaire, Jonathan Owen, Daniel Gromer, and Benoit Thieurmel. 2018. Dygraphs: Interface to ’Dygraphs’ Interactive Time Series Charting Library. https://CRAN.R-project.org/package=dygraphs.
Xie, Yihui, Joe Cheng, and Xianying Tan. 2020. DT: A Wrapper of the Javascript Library ’Datatables’. https://CRAN.R-project.org/package=DT.
Xie, Yihui, Christophe Dervieux, and Emily Riederer. 2020. R Markdown Cookbook. Boca Raton, Florida: Chapman; Hall/CRC. https://bookdown.org/yihui/rmarkdown-cookbook.