DATIKA
  • Posts
  • About
  • Materials
    • Presentations
    • Books
    • Datasets
  • Register
  • Gallery
  • Ressources
    • Semba blog
    • Semba website
    • Nyamisi blog
    • R Weekly
    • R Bloggers
  • Archive
Categories
All (28)
Data Science (10)
Data Visualization (12)
Mapping (3)
R Basic (1)
Statistics (4)
analysis (6)
code (15)
ggplot (10)
visualization (15)

Enhancing Tables with Flags Using the gt Package in R

visualization
code
Statistics
The post explaining how to use the gt package in R to format tables with flags and other features, along with data manipulation using tidyverse and rvest
Sep 6, 2024
Masumbuko Semba

Tracking the Growth of CRAN Packages

visualization
code
Statistics
This post explaining how to analyze and visualize the cumulative increase of CRAN packages using R and ggplot2
Sep 2, 2024
Masumbuko Semba

Summarize data frame with easy using the summarytools Package in R

visualization
code
Statistics
This post shows how to use the summarytools package in R with the Palmer Penguins dataset to summarize data.
Aug 20, 2024
Masumbuko Semba

Mapped: the GDP of WIO-Region

Mapping
Data Visualization
ggplot
Creating a Map of the Western Indian Ocean Region with gross domestic Product variation across the western indian ocean region
Jul 28, 2024
Masumbuko Semba

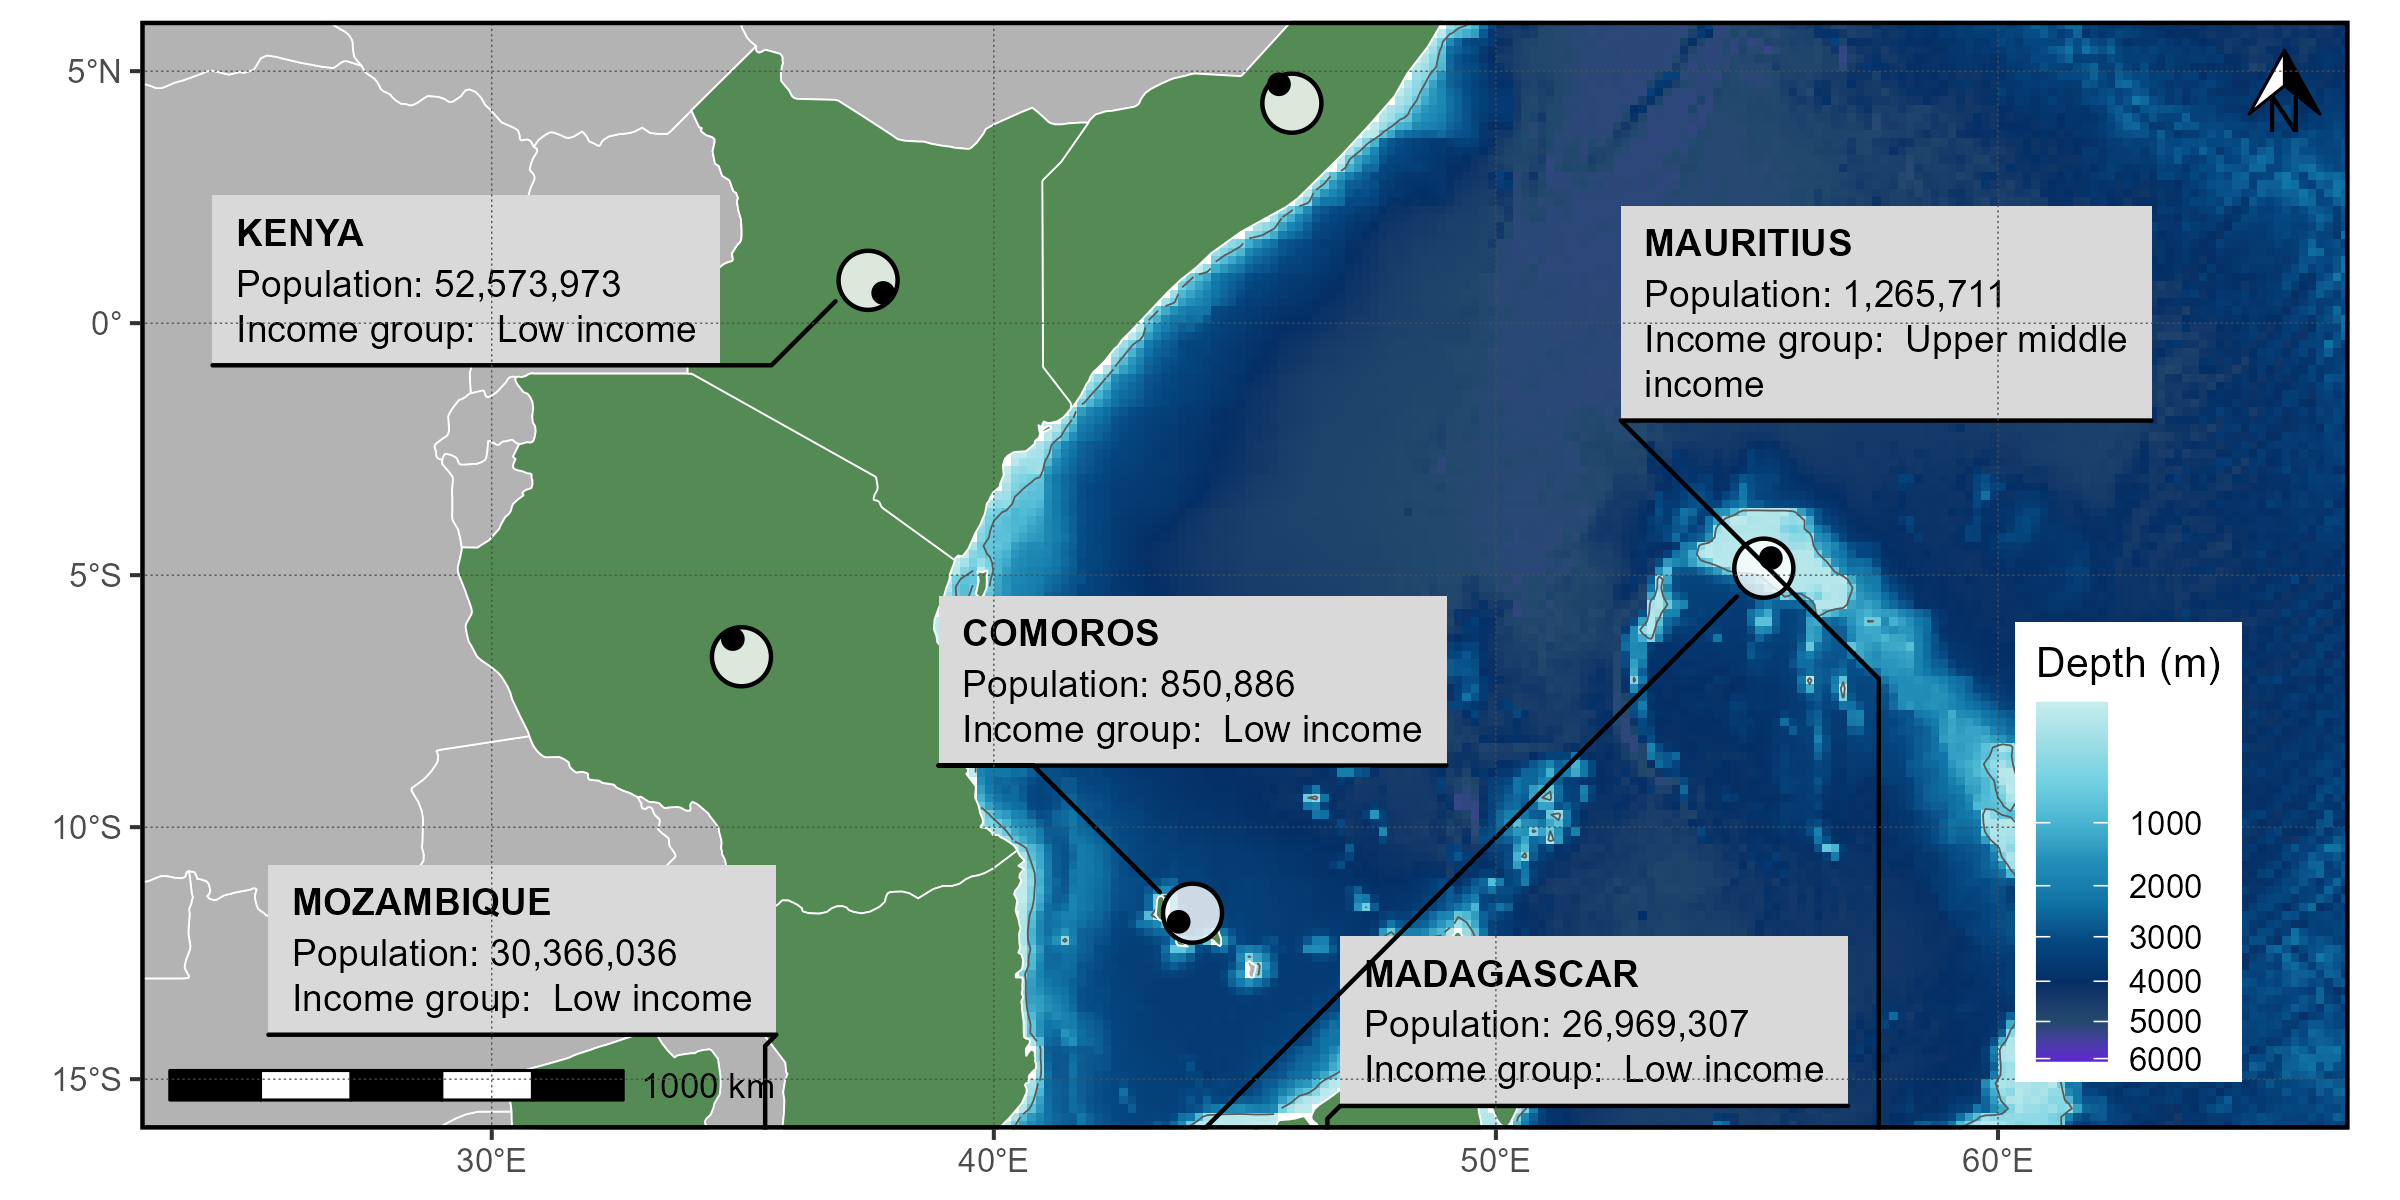
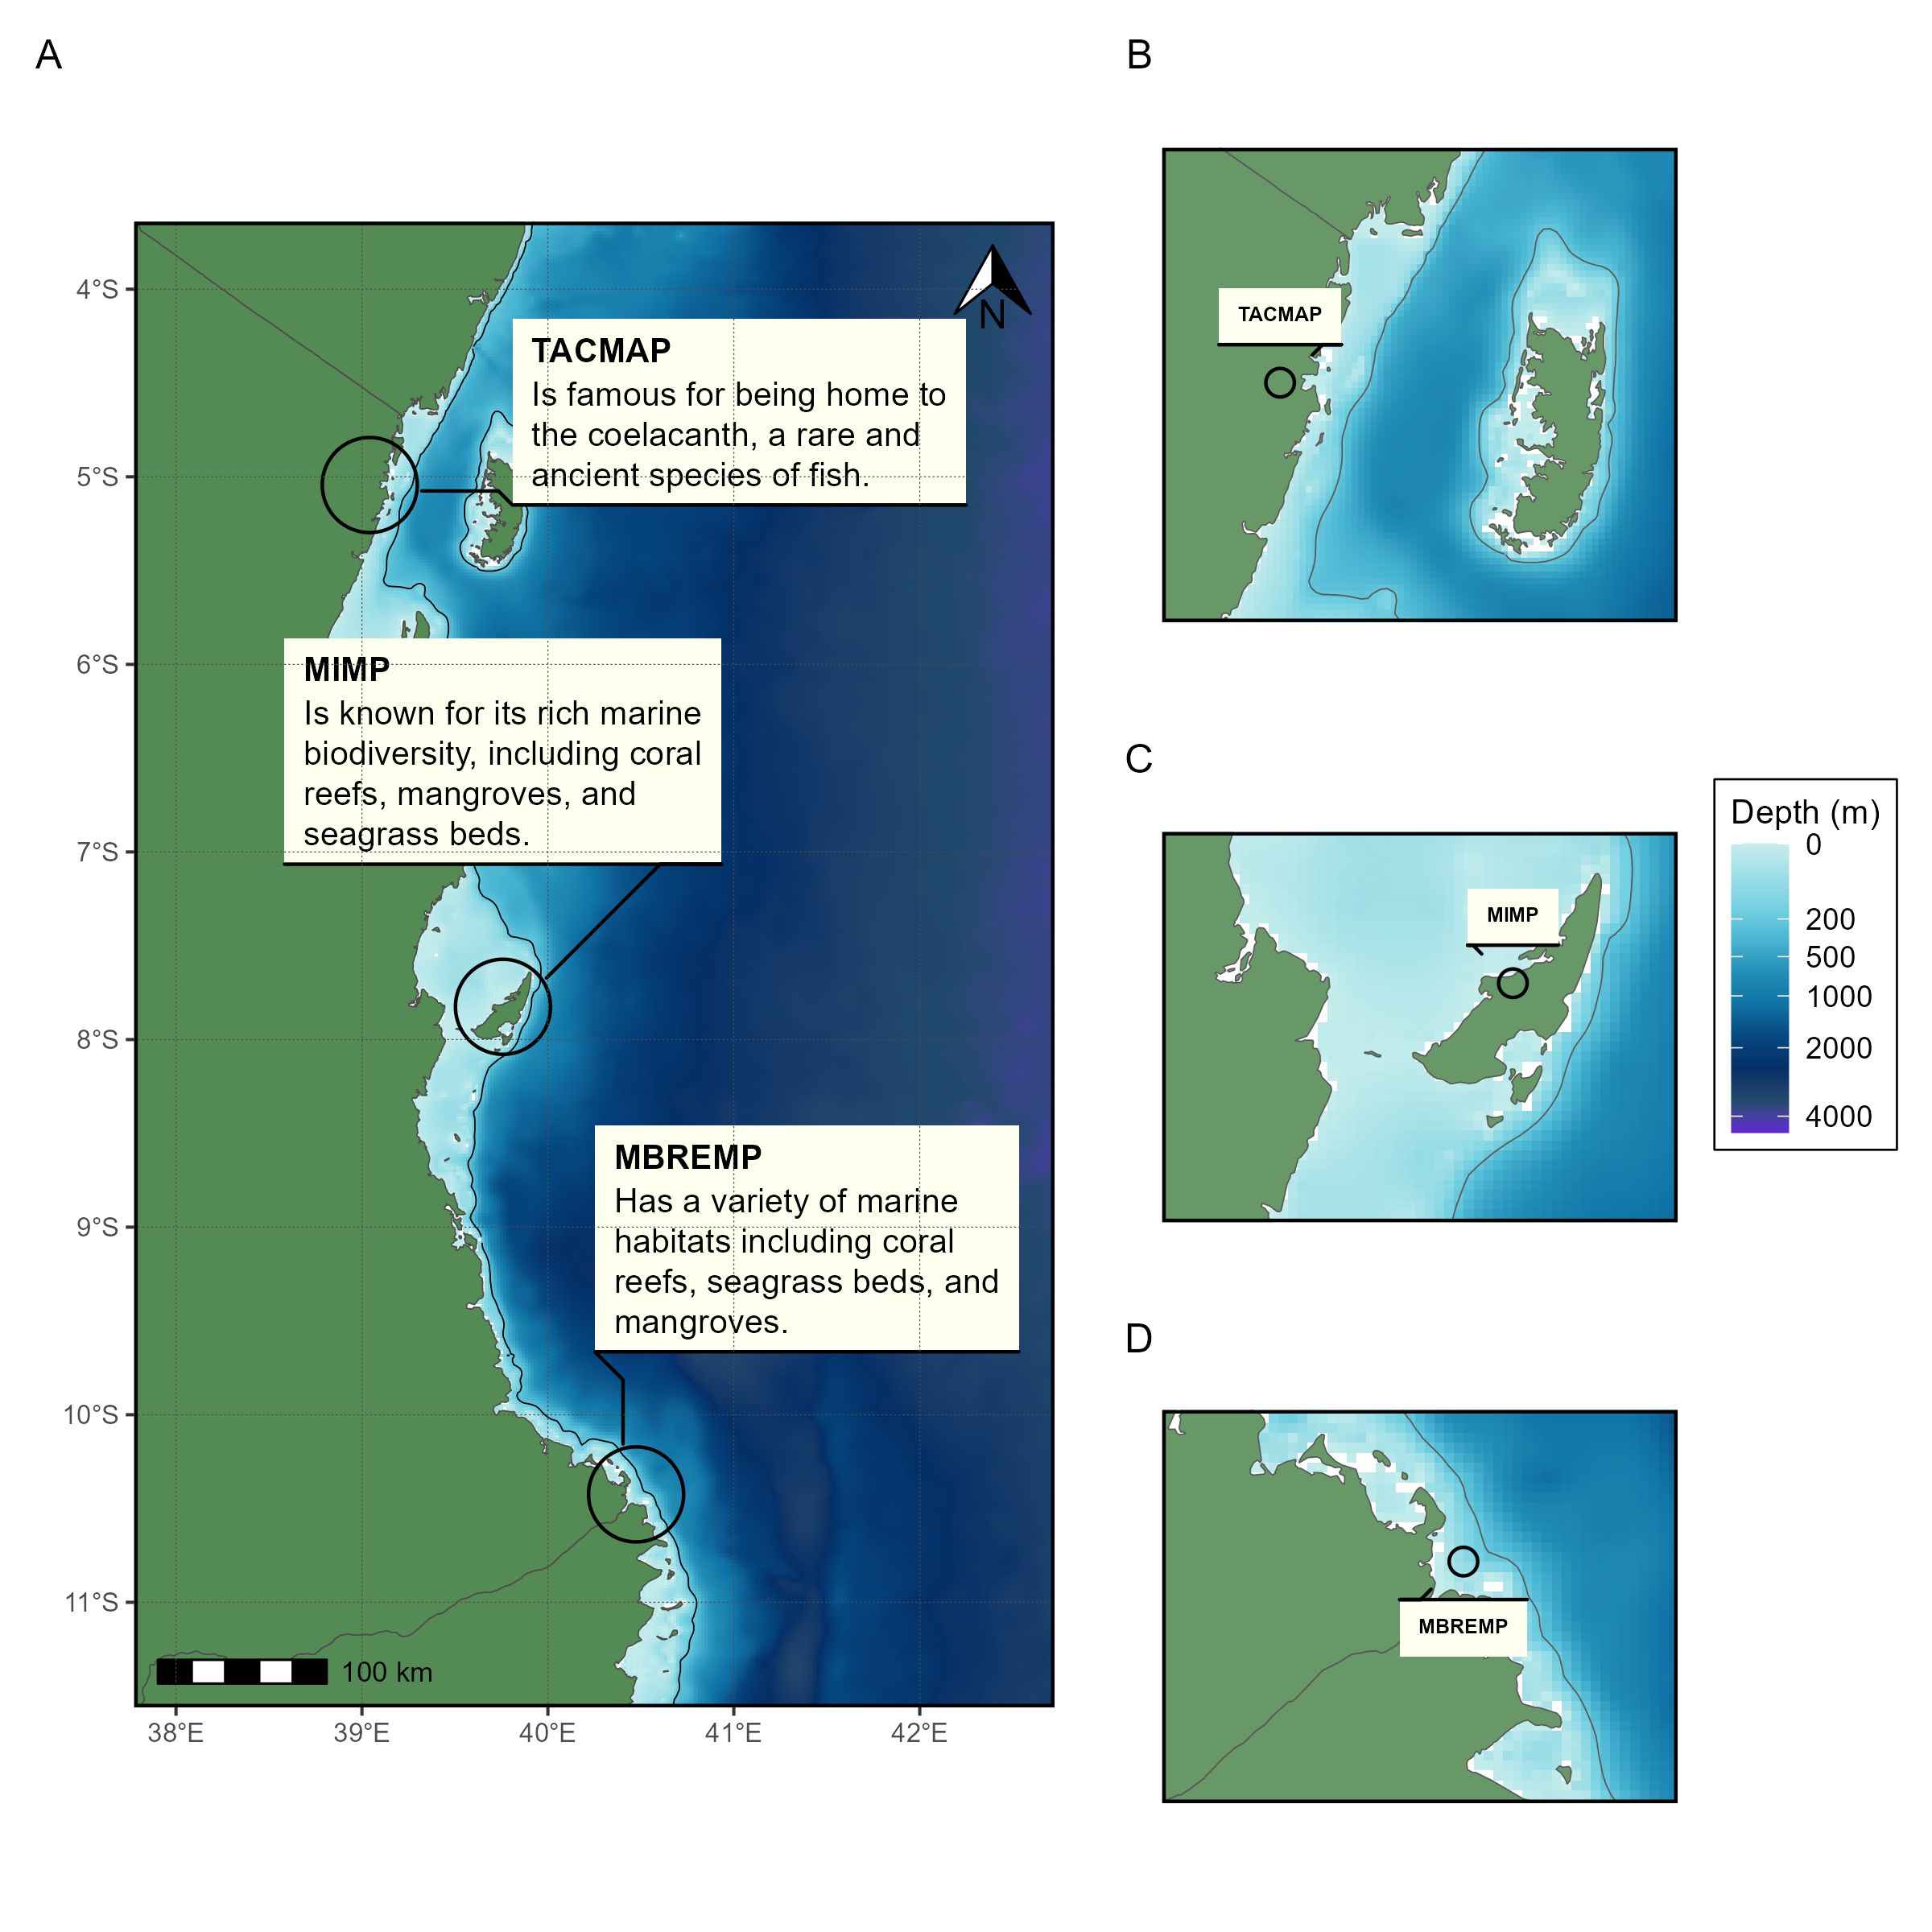
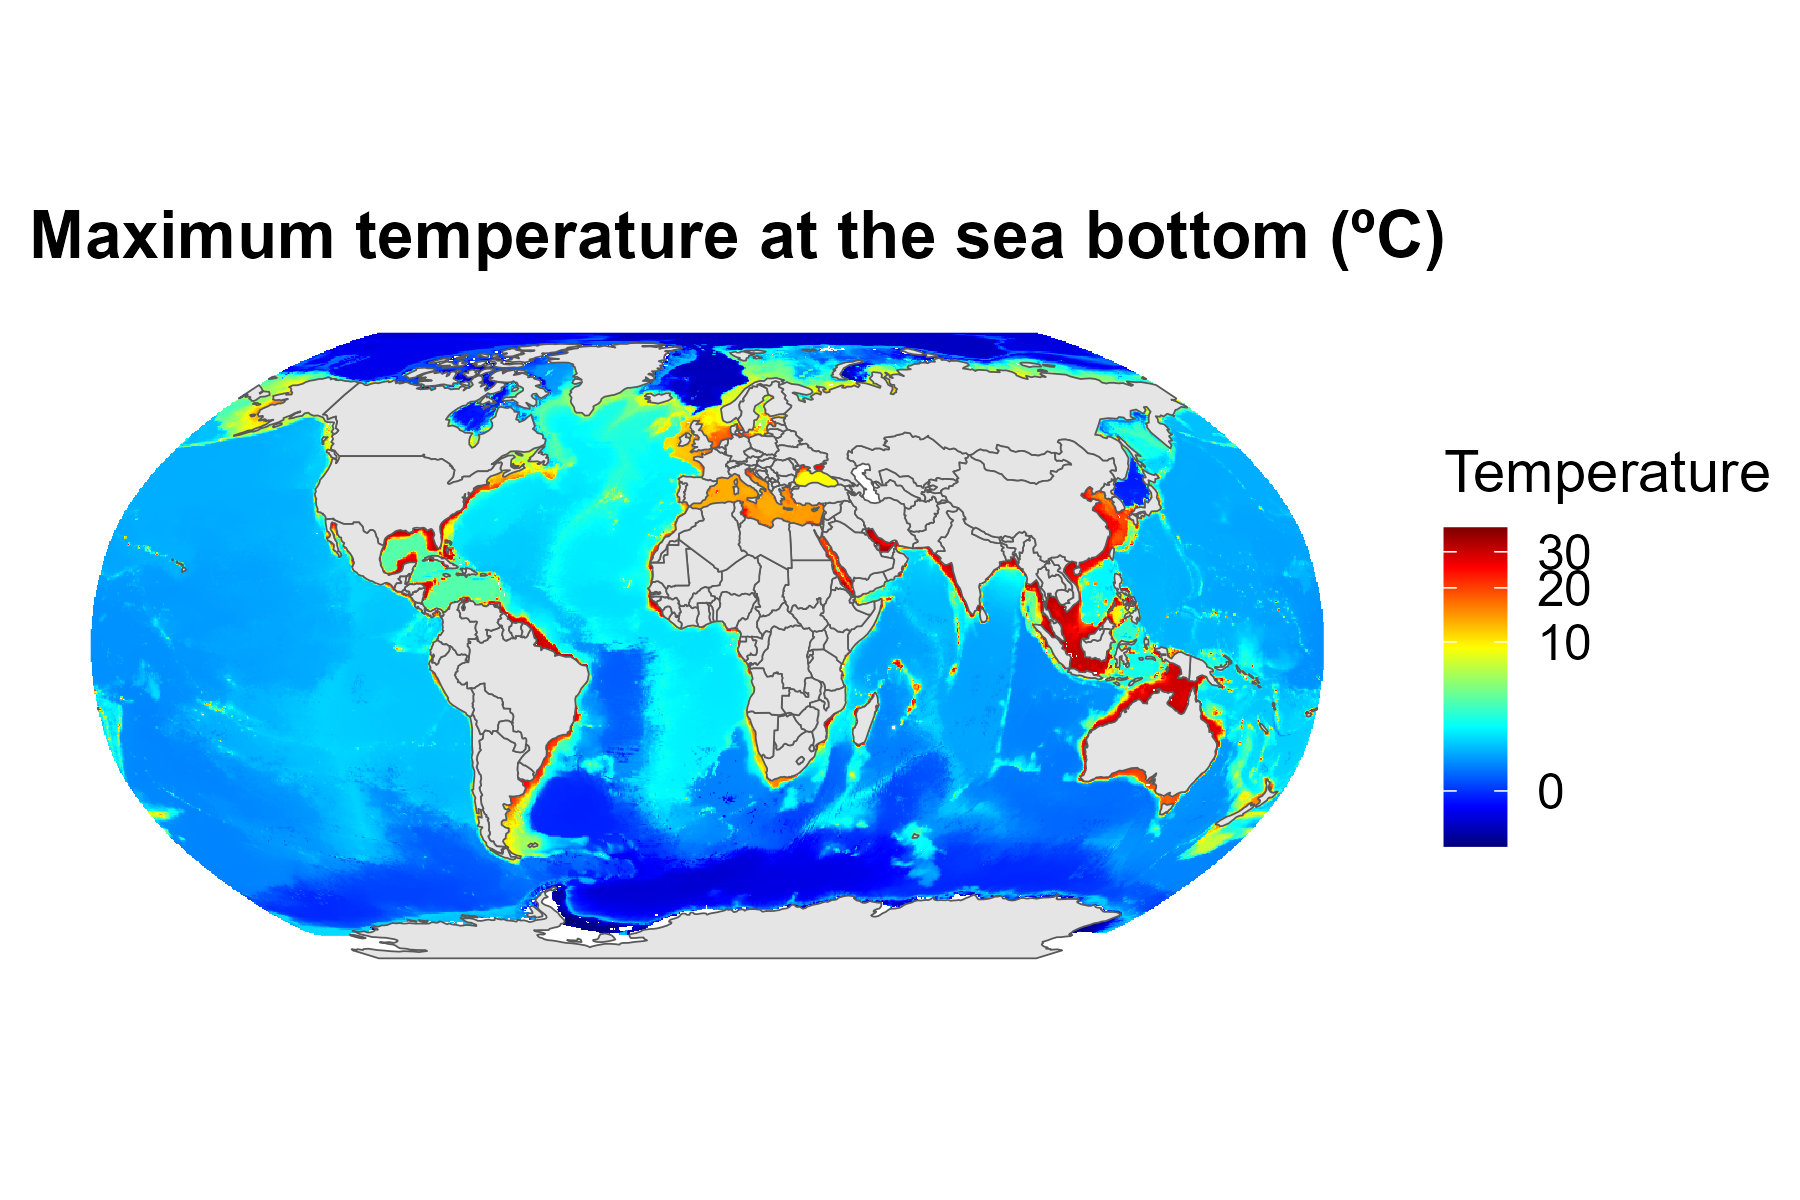
Mapped: the bathymetry of WIO-Region

Mapping
Data Visualization
ggplot
Creating a Map of the Western Indian Ocean Region with Bathymetry and Country Labels in R
Jul 24, 2024
Masumbuko Semba

Static Map for Publication in R

Mapping
Data Visualization
ggplot
This blog post takes you through steps you many need to create and generate maps for publication and presentation.
Jul 12, 2024
Masumbuko Semba

Simplifying Access to Bio-ORACLE Data with the sdmpredictors R Package

Data Science
Data Visualization
ggplot
In this post, we are going to discuss the R package sdmpredictors and how it facilitates the use of the Bio-ORACLE dataset for bioclimatic modeling
Jun 25, 2024
Masumbuko Semba

Visualize and compare change over time using gganimate.

Data Science
Data Visualization
ggplot
The article provides detailed instructions on using the gganimate package to animate a static ggplot2 plot, enhancing visualizations with dynamic transitions between data states.
Jun 20, 2024
Masumbuko Semba

Visualize the Peril of Global Ocean Aragonite Saturation with ggplot2

Data Science
Data Visualization
ggplot
This blog post provides an overview of the peril of global ocean aragonite saturation using ggplot2 for data visualization in R
Jun 15, 2024
Masumbuko Semba

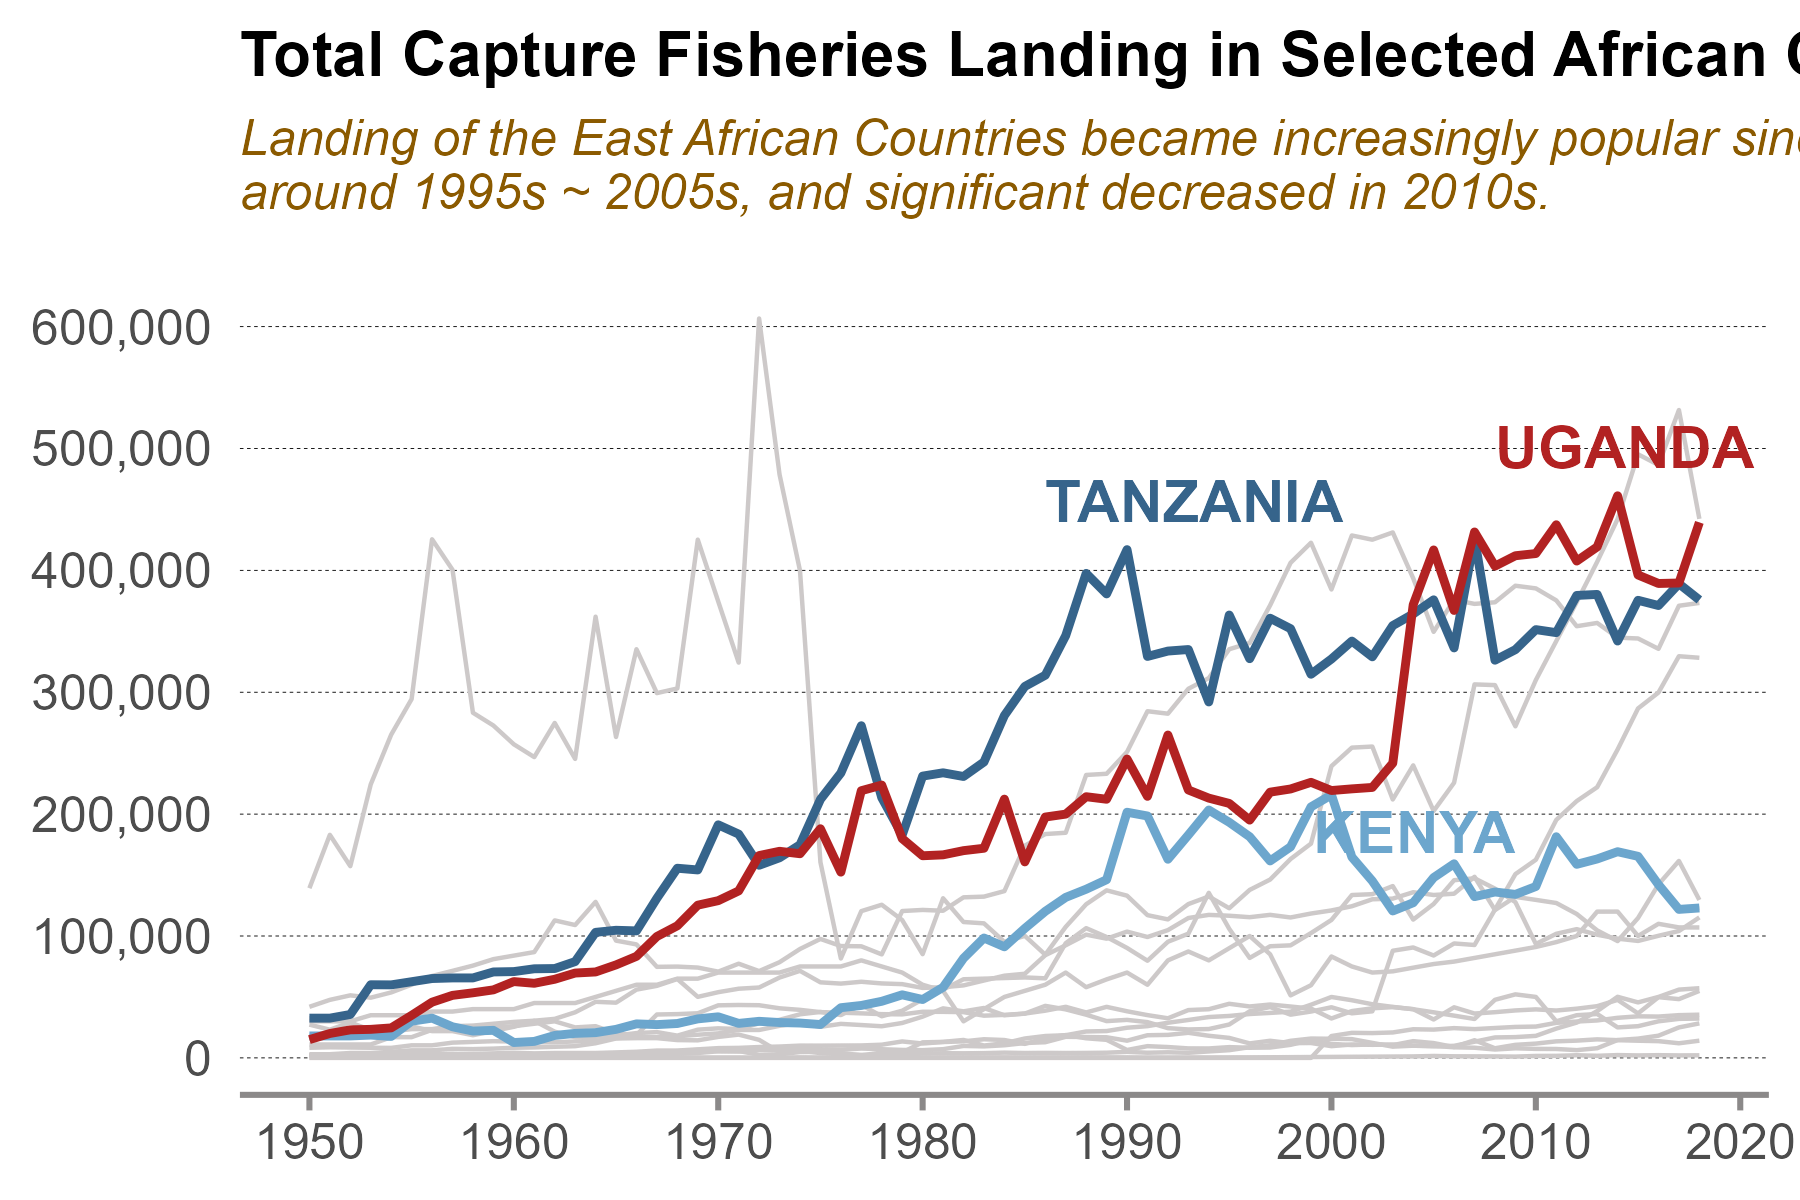
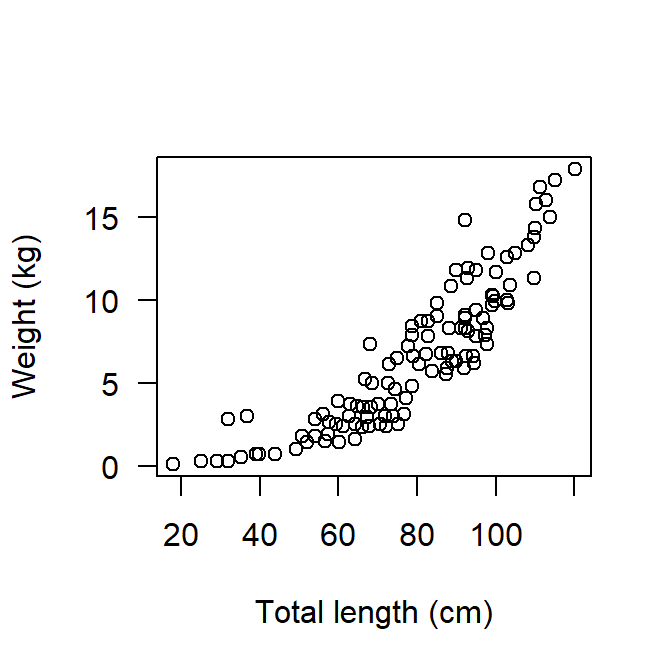
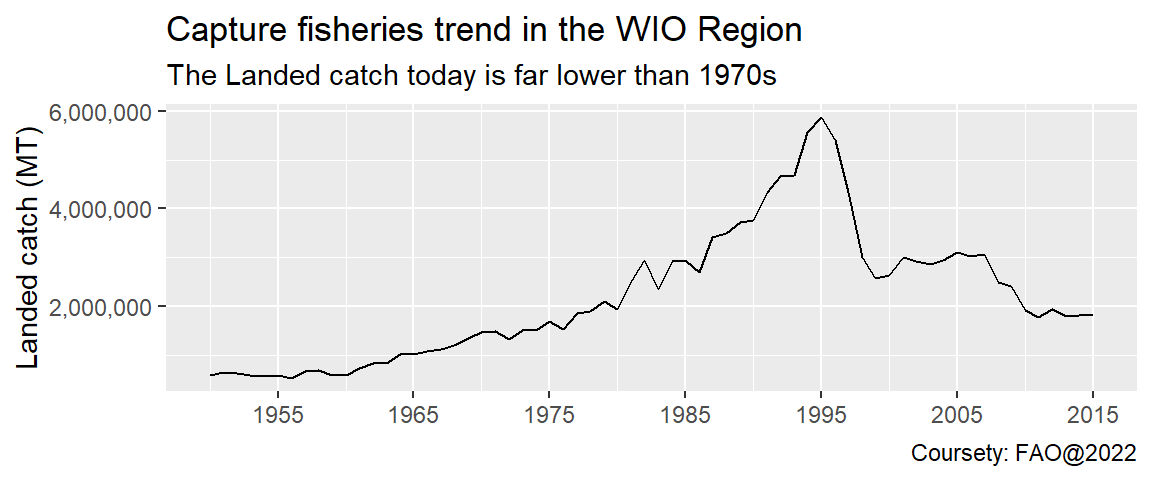
Visualize changing catch landings with ggplot2

Data Science
Data Visualization
ggplot
The post takes step-by-step on generating a line plot using ggplot2 in R to visualize how the capture fisheries landing has changed over time. It also illustrate how to annotate plot to highlight specific aspects or data points
Jun 9, 2024
Masumbuko Semba

The key process for plotting using ggplot2

Data Science
Data Visualization
ggplot
ggplot2 is a powerful and versatile data visualization framework in R that allows users to create elegant and informative plots through a structured, layered approach.
Jun 8, 2024
Masumbuko Semba

Visualize percentage change of catch landings using arrows in ggplot2

Data Science
Data Visualization
ggplot
The post takes step-by-step on generating a arrow line plot using ggplot2 in R to visualize how the capture fisheries landing has increased or decreased between 2000 and 2018 It also illustrate how to annotate the percenatage change for each country
Jun 6, 2024
Masumbuko Semba

Create lineplots using ggplot2 to visualize changes in global life expectancy

Data Science
Data Visualization
ggplot
using ggplot2, a popular data visualization package in R, to create line plots that visualize changes in global life expectancy over time.
Jun 2, 2024
Masumbuko Semba

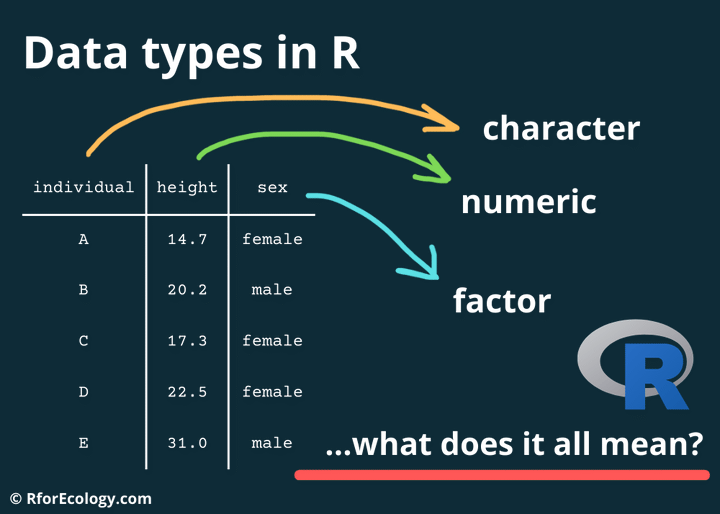
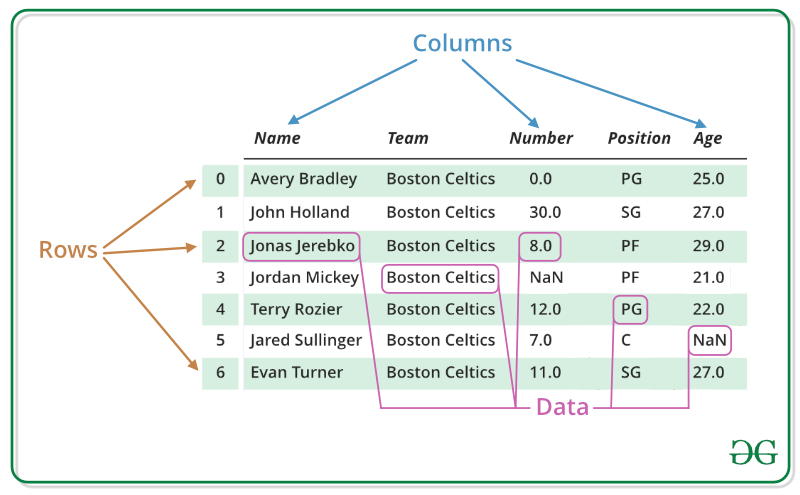
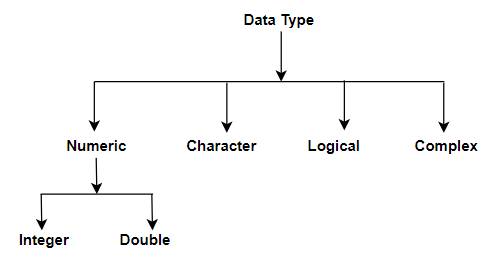
Vector Structure and Data types in R

Data Science
Data Visualization
The post provides an overview of the different data types in R, including numeric, integer, character, factor, and logical. It explains the characteristics of each data type and how to work with them. The article also covers some common operations and conversions between data types.
May 19, 2024
Masumbuko Semba

Data Visualization

Data Science
Data Visualization
Data visualization simplifies complex information, making it easier to understand and leading to more informed decision-making
May 5, 2024
Masumbuko Semba

Data cleaning, merging, and appending

visualization
code
analysis
In reality, data cleaning is not so much its own step in the data wrangling process as it is a constant activity that accompanies every other step, both because most data is…
May 1, 2024
Masumbuko Semba

Tidying Data frame

visualization
code
analysis
The post Data cleaning, merging, and appending demonstrates data manipulation with a dplyr package (Wickham et al., 2019) and Basic plots with ggplot2 introduce plotting…
Apr 29, 2024
Masumbuko Semba

Understanding Descriptive Statistics

visualization
code
Statistics
Examine measures of center and dispersion of the data so that we can gain valuable insights into the characteristics and distribution of various metrics that are in a dataset
Apr 25, 2024
Masumbuko Semba

Basic plots with ggplot2

visualization
code
analysis
The ggplot2 package provides a set of functions that mirror the Grammar of Graphics (Wickham, 2016), enabling you to efficaciously specify what you want a plot to look like.…
Apr 1, 2024
Masumbuko Semba

Visualizing data with grammar of graphics

visualization
code
analysis
The ability to create visualizations—graphical representations of data is an important step to convey results—information and findings to others. Visualizations make it much…
Mar 25, 2024
Masumbuko Semba

Importing table files into R

visualization
code
Learning to import tabular files from local directory intot R session is an important skills in R programming
Feb 26, 2024
Masumbuko Semba

Understanding vector and dataframe

visualization
code
Understanding vectoor and dataframe as core data storage in R is an important part, which allows for data analysis and visualization
Feb 12, 2024
Masumbuko Semba

Mastering Data Structures in R

visualization
code
Learn the primary data structures (vector and data frame) in R, which are the foundation of data manipulation and analysis in R
Feb 3, 2024
Masumbuko Semba

Understanding and using Data types in R

visualization
code
Learn the primary data types in R, which are the foundation of data programming in R
Jan 26, 2024
Masumbuko Semba

Getting Started with R and RStudio

visualization
code
Learn the basic of programming with R using RStudio. We’ll install R, and RStudio RStudio, an extremely popular development environment for R
Jan 24, 2024
Masumbuko Semba

The basics of R programming

Data Science
R Basic
The R programming language serves as a powerful tool for statistical computing and graphics, offering extensive capabilities for data analysis, visualization, and modeling
Jan 24, 2024
Masumbuko Semba

The basics of R and Rstudio

visualization
code
analysis
Understanding the building blocks of R and its working environment Rstudio for smooth operations in data science
Jan 24, 2024
Masumbuko Semba

Creating a Timeline graphic using R and ggplot2

visualization
code
analysis
Creating a timeline graphic using ggplot2, which is a powerful data visualization library in R
Nov 24, 2023
Masumbuko Semba
No matching items

    ©2024 Datika

    • FAQ

    • Feedback

    • License

    • Terms

    Cookie Preferences