Chapter 4 Results
4.1 Temporal and Spatial Distribution of Chlorophyll-a
Richmond and others (2002) have divided the monsoon seasons along the East African coast into northeast (NE) and southeast (SE). These seasons have different characteristics. The SE monsoon (March to October) has high cloud cover, dry, strong wind and decreased temperature and light (McClanahan 1988). This is contrast to NE characterised by low cloud cover, wet, weak wind, increased temperature and light. Figure 4.1 show the variation of chlrophyll across the study area and at two distinct monsoon winds. The dry period (SE monsoon) has relalatively higher chl-a (Figure 4.1b) than the wet period (NE monsoon) (Figure 4.1a). And the concentration of chlorophyll is higher in Zanzibar channel than in Pemba channel in dry season (Figure 4.1b) and wet season (Figure 4.1a).
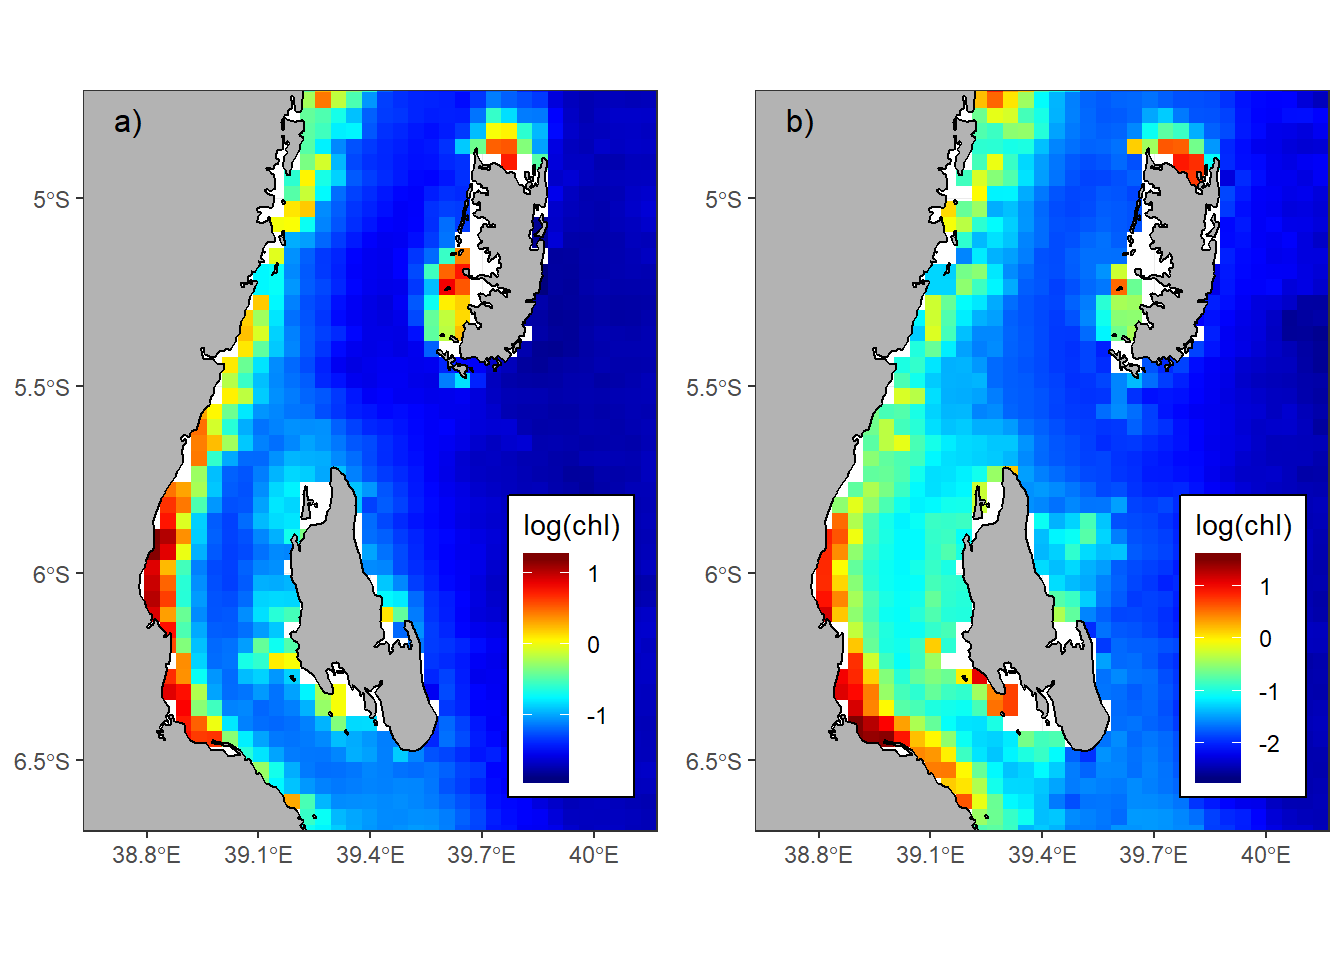
Figure 4.1: MODIS images showing Chlorophyll-a distribution for the Zanzibar and Pemba channels during a)rain and b)dry season
The seasonal variation in figure 4.1 provide a snapshot of chlorophyll variation based on two monsoon influence. Figure 4.2 show the climatological monthly variation of Chl-a concentration in the study area. From November, the chl-a concentration decrease gradually until the maximum value in March and then began to increase and reaches its peak in August. Generally, the concentration of Chl-a had declined from November to April and a relatively high concentration during this period was restricted to a narrow strip along the coast (Figure 4.2).
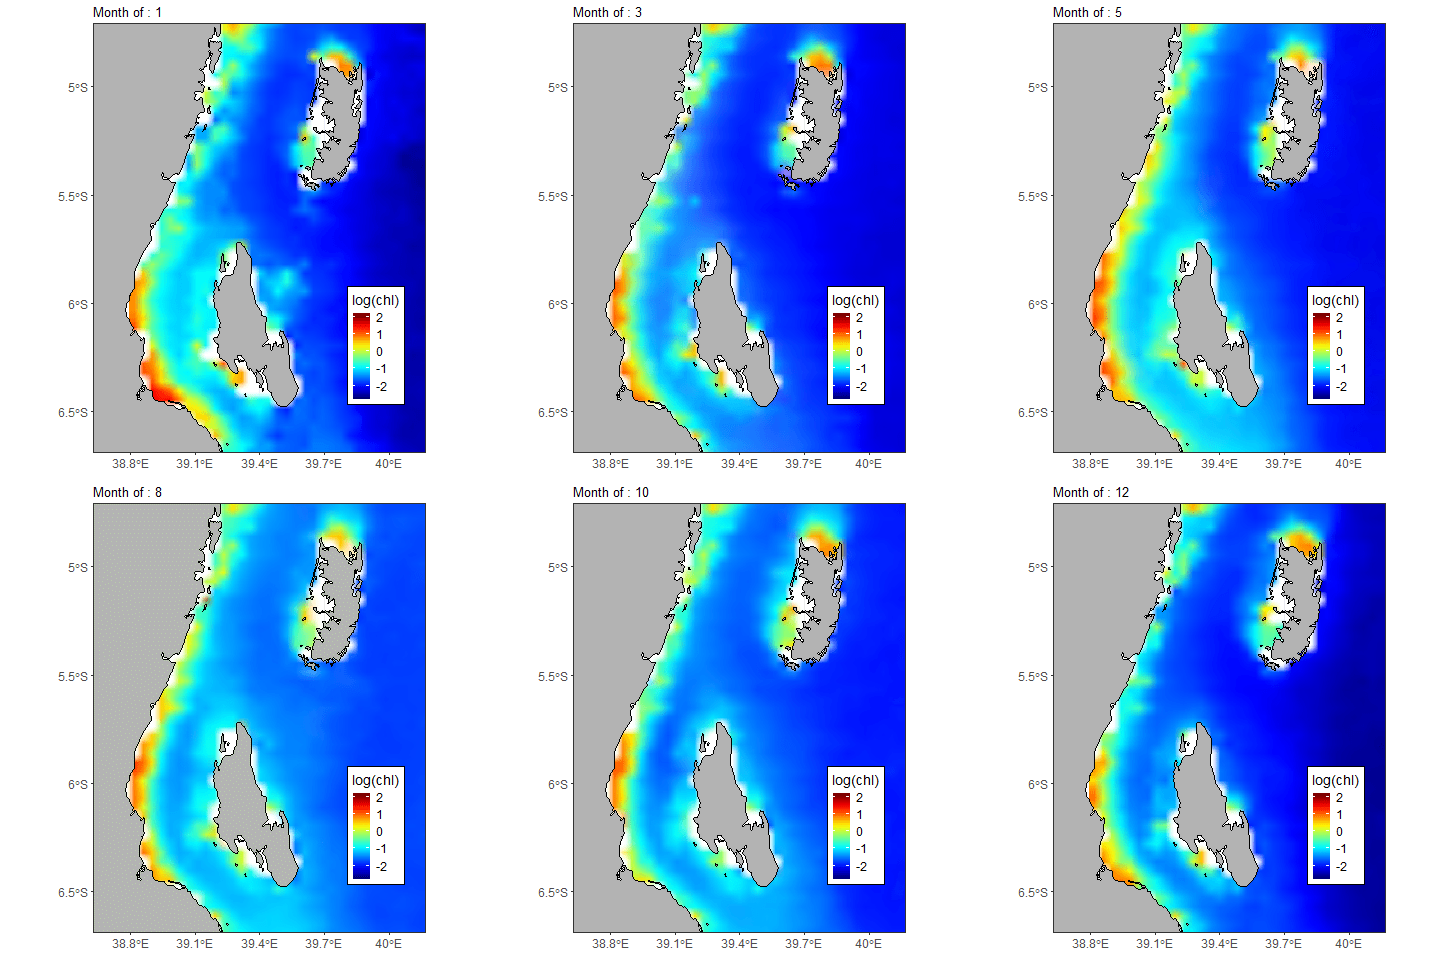
Figure 4.2: Monthly climatology of chlorophyll-a concentration within the Pemba and Zanzibar Channels
The chl-a from in-situ shows similar spatial pattern as that of satellite observation in the Pemba channel. Rain period (Figue 4.3a) has significant higher chlorophyll values than dry season (Figure 4.2b). The areas close to the Pangani River estuary have the highest concentration in both seasons (Figure 4.3a & 4.3b). While in rainy season, the Pemba channel had highest values of Chl-a close to the Pangani river mouth (Figure 4.3), the dry season, there was a relatively low concentration to this area except around the river mouth and on the southern part of the Pangani river mouth (Figure 4.3 which was having a relatively higher Chl-a concentration. The concentration value of chlorophyll-a was signfificant higher in rain season than the dry season (Table 4.1).
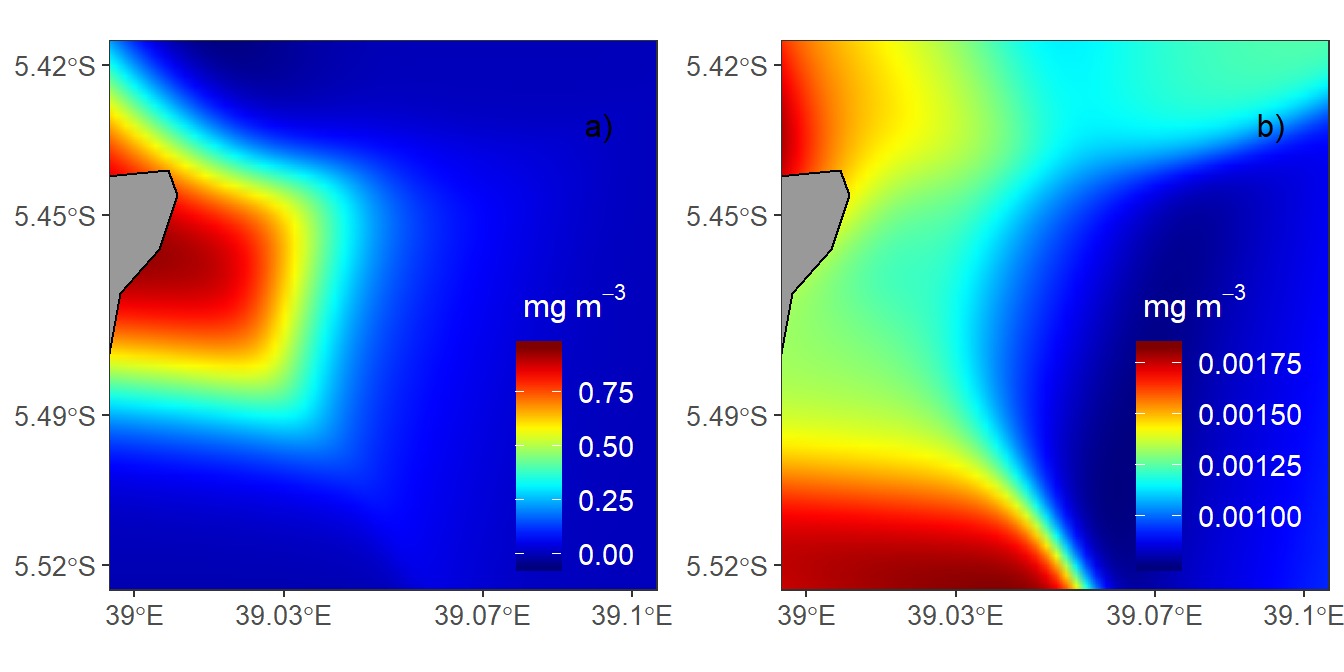
Figure 4.3: Spatial distribution pattern of in situ chlorophyll-a at the Pemba channel site (a) Rainy season (b) Dry season
| Site | Season | Critical value | p value | Pattern | Significance |
|---|---|---|---|---|---|
| Zanzibar | Dry | 0.05 | 0.09950 | Random | NS |
| Zanzibar | Rainy | 0.05 | 0.00020 | localized | *** |
| Pemba | Rainy | 0.05 | 0.00001 | localized | *** |
| Pemba | Dry | 0.05 | 0.06000 | localized | NS |
However, the scale used in Figure 4.3a and 4.3b are different. When similar scale was used, the chlorphyll value at the surface for the dry season are vey low (Figure 4.4b). There was no any spatial pattern observed since the Chl-a concentration for the dry season at the Pemba channel was below 0.001.
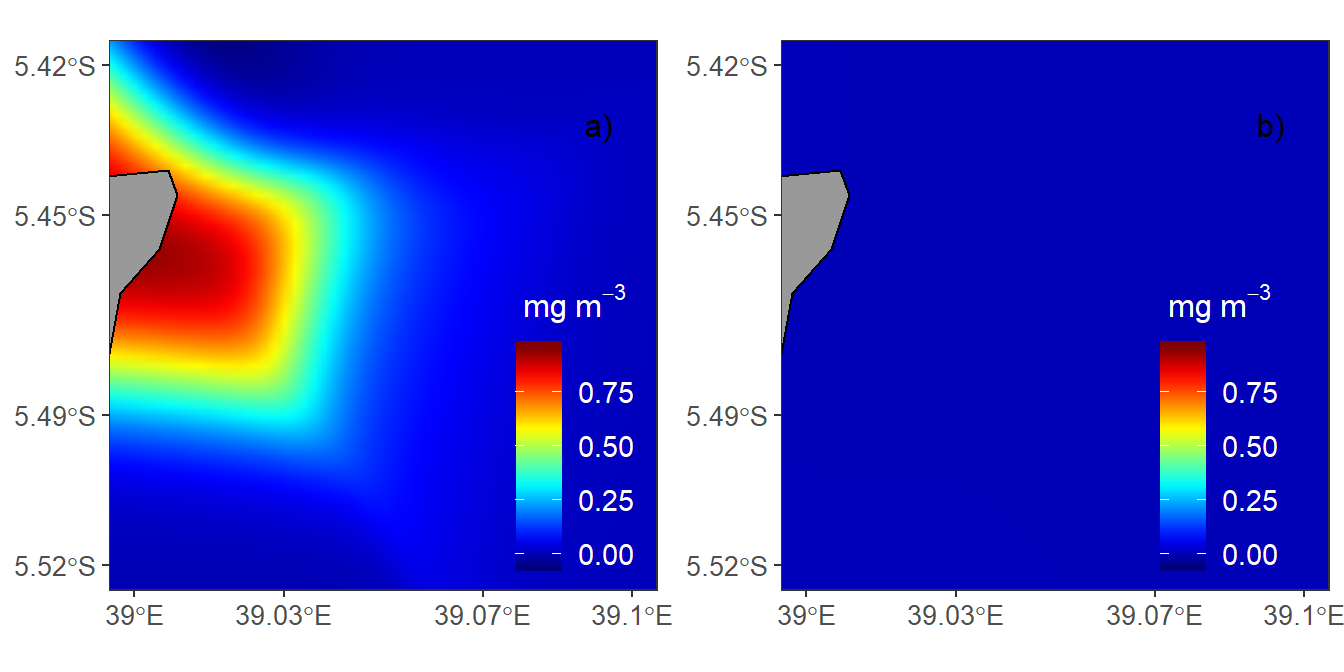
Figure 4.4: Spatial distribution pattern of in situ chlorophyll-a at the Pemba channel site in the same scale for (a) Rainy season (b) Dry season
For the Zanzibar channel site highest Chl-a values were found along the coastline but and the dongue of highest value was found to the northern part study area during the rain (Figure 4.5a) and dry (Figure 4.5b). There was a significant decreasing chl-a concetration away from coastline during the rainy season (Table 4.1).
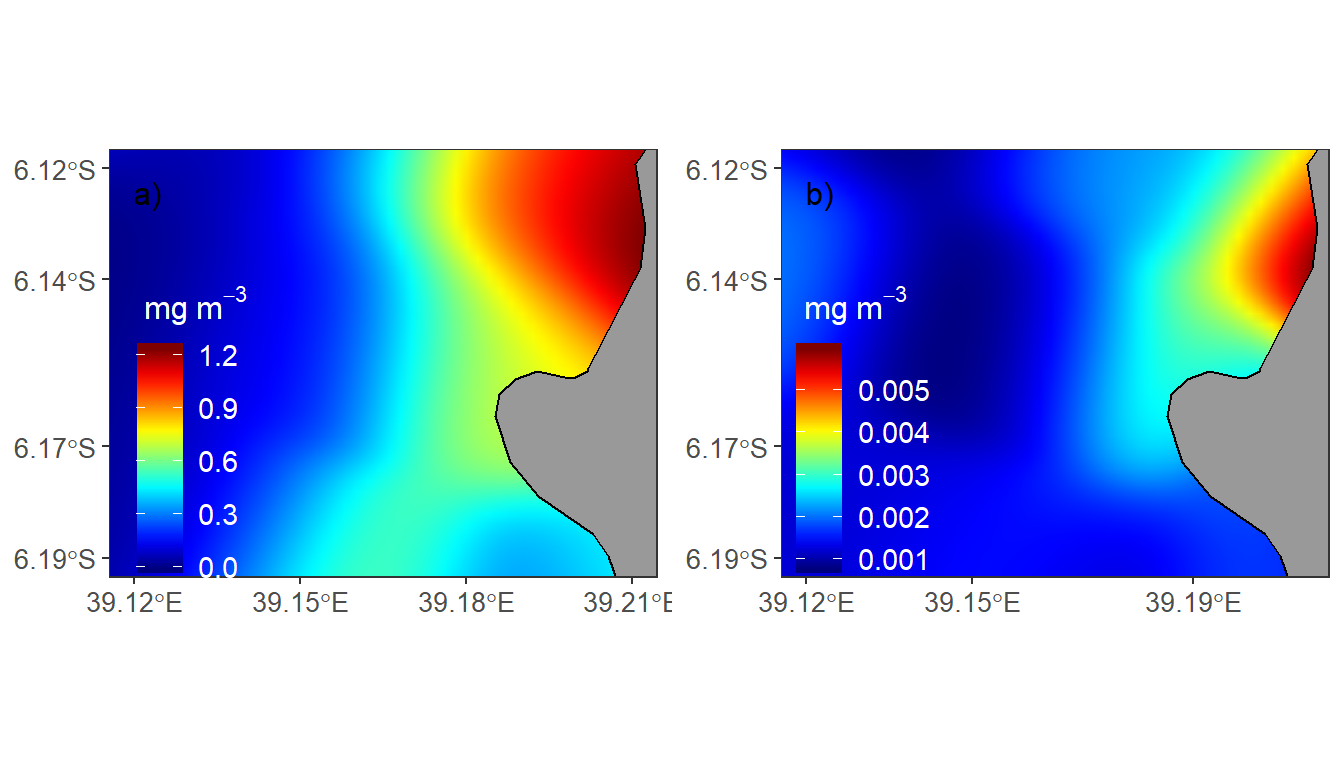
Figure 4.5: Spatial distribution pattern of in situ chlorophyll-a at the Zanzibar channel site (a) Rainy season (b) Dry season
4.2 Temporal and Spatial Distribution of Sea Surface Temperature
The results on temporal and spatial distribution of sea surface temperature (SST) for the Zanzibar and Pemba channels during dry and wet seasons are shown in figure 4.6. The rain period was relatively warmer (Figure 4.6a) compared with the dry season (Figure 4.6b). in both seasons, the Zanzibar Channel was warmer than the Pemba Channel (Figure 4.6)
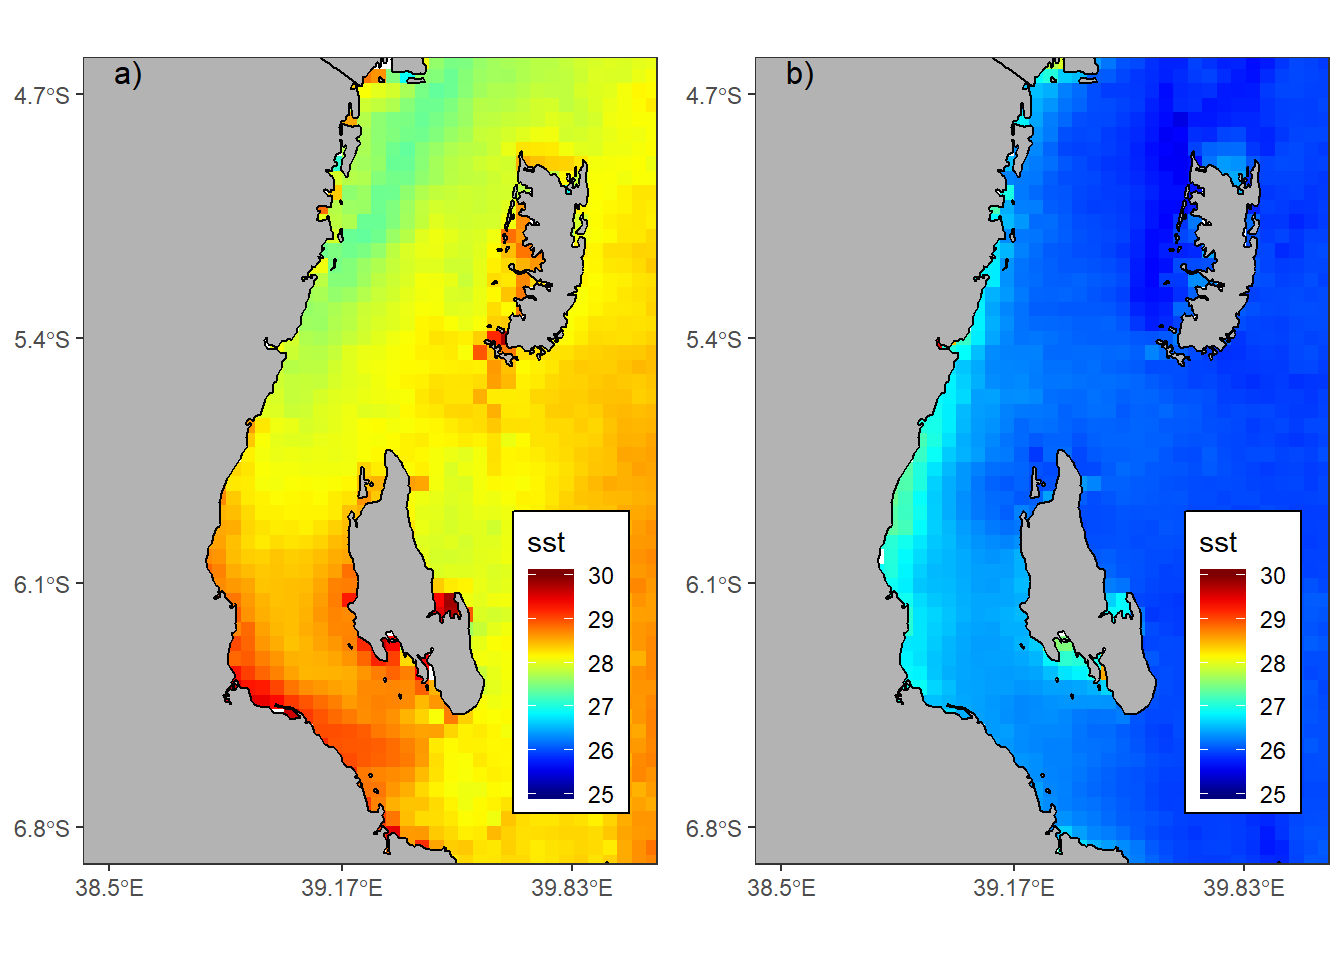
Figure 4.6: MODIS images showing Sea Surface Temperature distribution for the Zanzibar and Pemba channels during a)rain and b)dry season
4.3 Chlorophyll-a and Sea Surface Temperature Variation
Figure 4.7 show climatological monthly mean variation of Chl-a and SST for the study area (Figure 3.1 & 3.2) . SST and chl-a revealed a complete inverse relation. There was a decrease in Chl-a concentration from January to March when the SST increased, and the Chl-a concentration increased from April and May and at this time the SST decreased. There were a slightly decrease in Chl-a on June whilst the SST marginally decreased and the Chl-a decrease from September to December and during this period SST was very high.
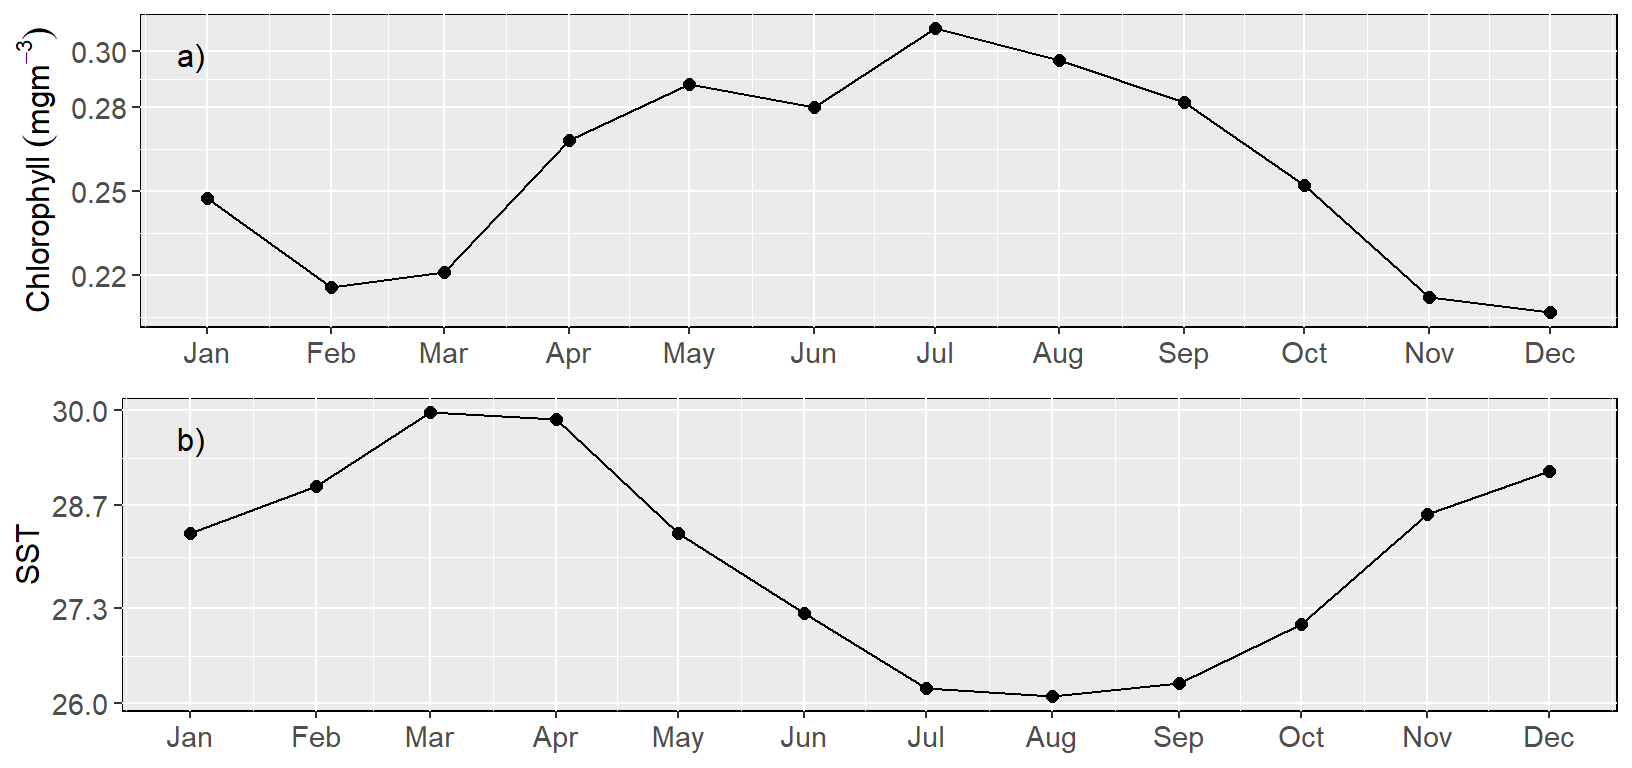
Figure 4.7: Monthly mean climatology of a) chlorophyll-a and b) sea surface temperature for Pemba and Zanzibar Channel
The mean Chl-a concentration displayed a bimodal distribution with first peak on May and the second high peak in April-May and in July-August (Figure 4.8. Figure 4.8 is similar to figure 4.7, but combine the sea surface temperature and chlorophyll-a value on the same plot and the inverse relation between sst and chl become apparent. The month with high SST experience low chl and viceversa. Kruskal-Wallis ANOVA (KWANOVA) test showed a significant difference in Chl-a over the twelve climatological months (H = 66.23, 11 d.f, p < 0.05) and SST (H = 244.27, 11 d.f, p < 0.05) variation among months.
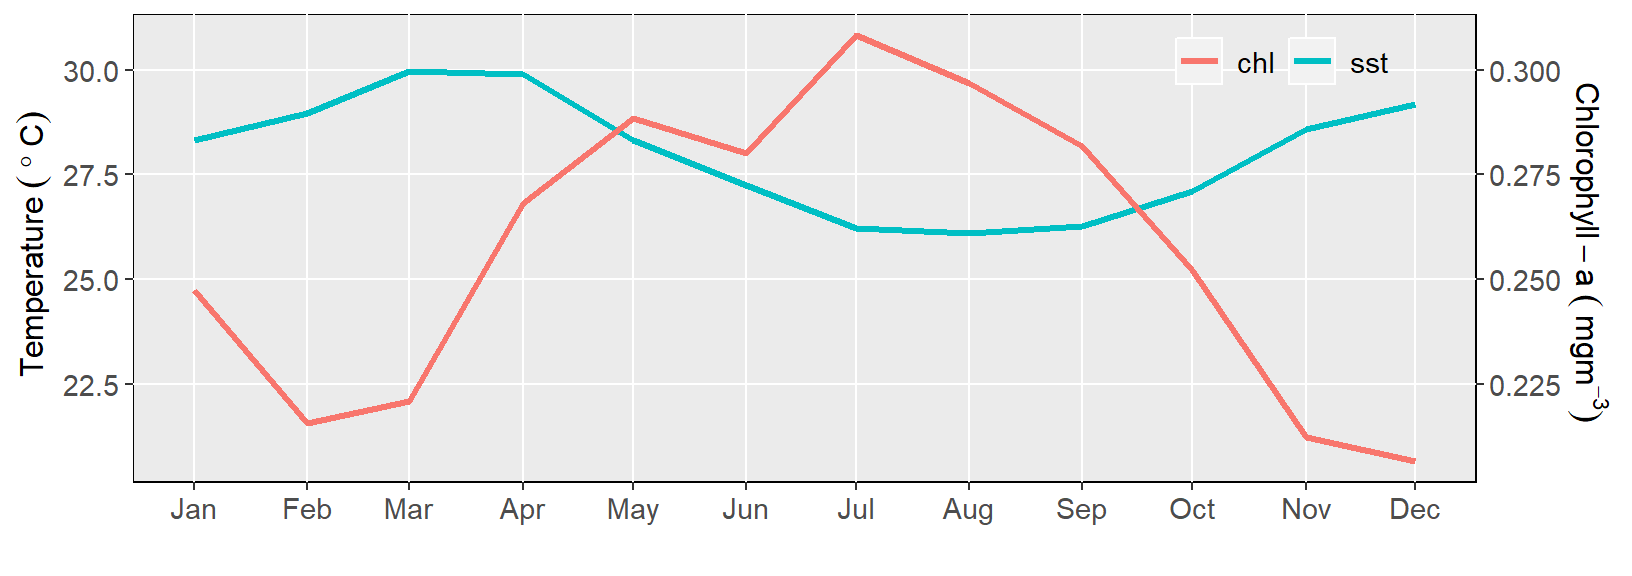
Figure 4.8: Monthly mean climatology of a) chlorophyll-a and b) sea surface temperature for Pemba and Zanzibar Channel
The Pearson correlation between satellite SST and satellite Chl-a showed a strong inverse relation between satellite SST and Chl-a (Figure 4.9), which was significant (r = -0.70, p < 0.05).
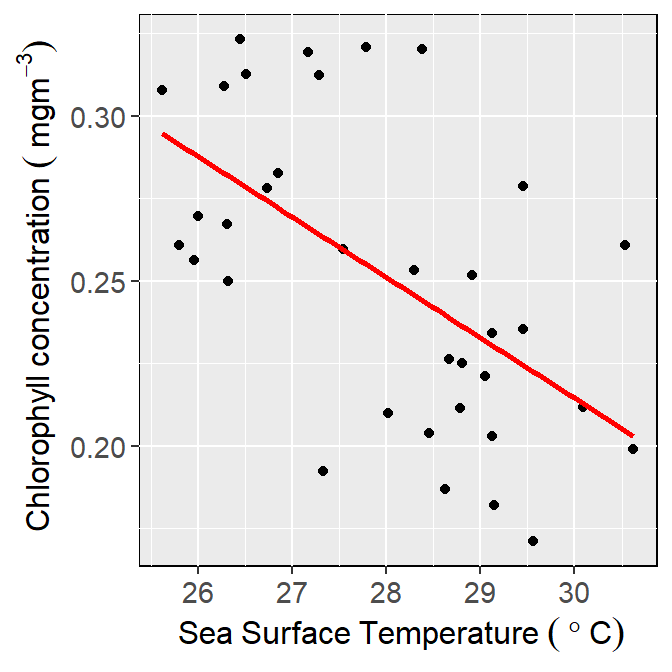
Figure 4.9: Correlation between mean monthly satellite Sea Surface Temperature and chlorophyll-a concentration within the study area
4.3.1 Seasonal Variation of Chlorophyll-a Concentration
The variation of Chl-a concentration in the study region was observed during the dry (SE monsoon) and the rainy (NE monsoon) seasons. Considering the in situ seasonal Chl-a variations between seasons at Zanzibar and Pemba channels, the concentration was relatively higher at both study sites during the rainy season, with an average Chl-a concentration of above 0.31 mgm-3 compared to dry season, in which the Chl-a concentration was observed to be below 0.06 mgm-3 (Figure 4.10. The results revealed that the variation of the in situ Chl-a concentration between seasons was significant (U= 19, 1d.f., p < 0.05).
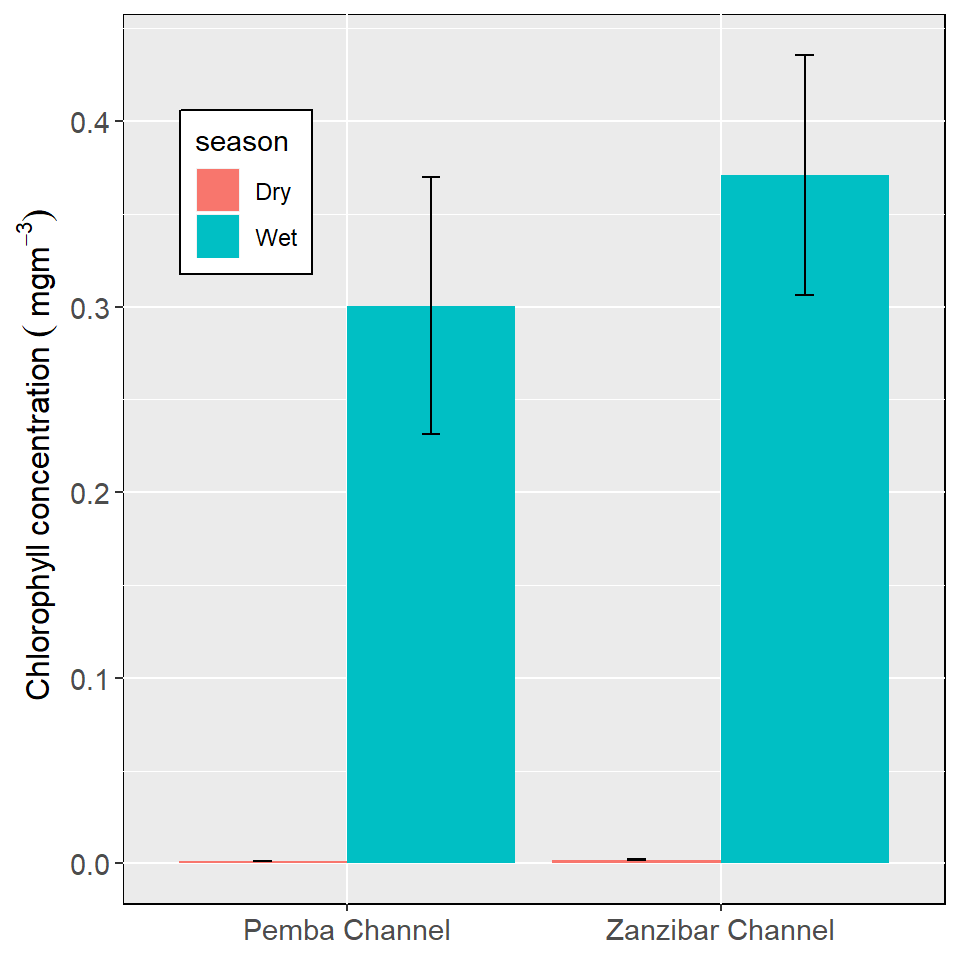
Figure 4.10: The mean in situ chlorophyll-a concentration with standard error of the mean between Zanzibar and Pemba channel sites during the dry and rainy seasons
Considering the Chl-a concentration between sites and among seasons, Zanzibar channel had slightly higher concentration compared to the Pemba channel site in both dry and rainy seasons (Figure 4.10, which was significant (F_{3, 116}_=16.96, p < .05). This difference in Chl-a concentration between sites and among seasons was further analysed using Bonferroni means comparison test. It was observed that Chl-a concentration between different seasons and among different sites was statistically significant, except for between sites in the same season (Table 4.2)
| Site & Season | Site & Season | t-value | p-value | Significance |
|---|---|---|---|---|
| Zanzibar Rainy | Pemba Rainy | 1.05182 | 1×100 | NS |
| Pemba Dry | Pemba Rainy | -4.46650 | 1.1×10⁻⁴ | *** |
| Pemba Dry | Zanzibar Rainy | -5.51830 | 1.3×10⁻⁶ | *** |
| Zanzibar Dry | Pemba Rainy | -4.45870 | 1.2×10⁻⁴ | *** |
| Zanzibar Dry | Zanzibar Rainy | -5.51050 | 1.3×10⁻⁶ | *** |
| Zanzibar Dry | Pemba Dry | 0.00784 | 1×100 | NS |
4.4 Variation of Between Transects
Insitu chl-a concentration revealed considerable variation between seasons and among transects. At the Pemba channel, the values of Chl-a were relatively higher at transect 2 compared to transects 1 and 3 during the rainy season. The average Chl-a concentration for transect 2 was generally above 0.5 mgm-3, while the average Chl-a concentration for transects 1 and 3 was generally below 0.26 mg/m3 (Figure 4.11). During the dry season, the concentration of Chl-a was relatively very low at all the three transects (Figure 4.11a) compared with the wet season (Figure 4.11b).
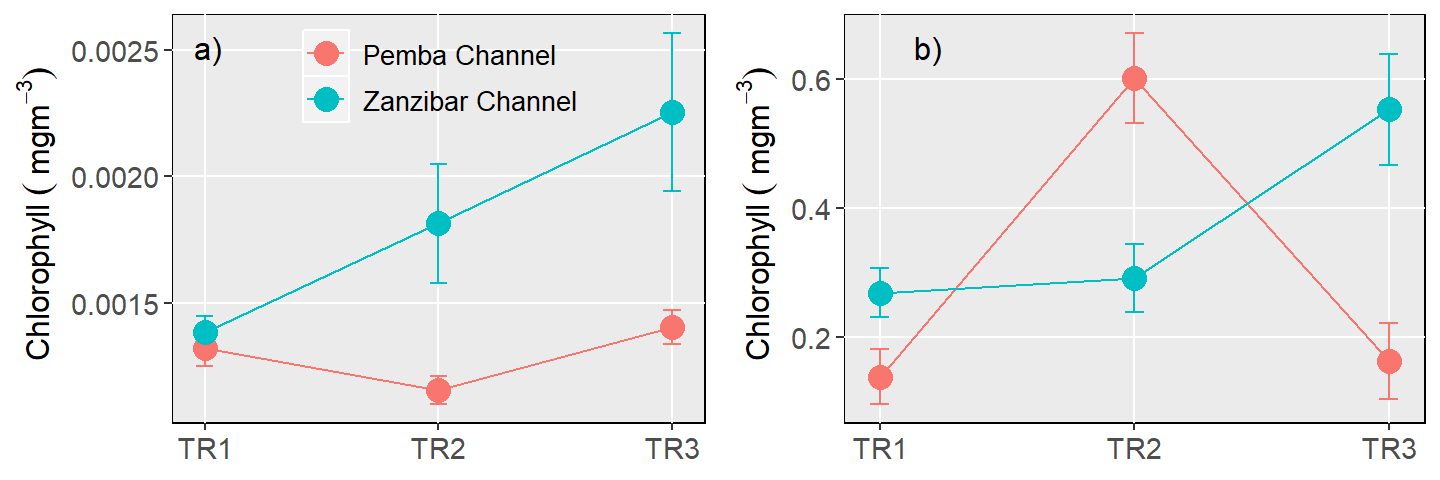
Figure 4.11: The mean and error of chlorophyll-a concentration and variation between transects within the study sites during a) dry season and b) wet season
At the Zanzibar channel site during the rainy season, the concentration of Chl-a was relatively higher for transect 3, with a mean concentration of above 0.48 mgm-3 compared to transects 1 and 2 that were observed to have mean concentration below 0.36 mgm-3 (Figure 4.11). Similar to the Pemba channel site, the concentration of Chl-a at the Zanzibar site during the dry season, was relatively very low for all the three transects (Figure 4.11a). This variation in Chl-a concentration among transects showed a difference statistically at the Pemba channel site during the rainy season only and there was no significant difference in Chl-a concentration among transects during the dry season for the Pemba site and at the Zanzibar site in both seasons (Table 4.3).
| Site & Season | F-value | p-value | Significance |
|---|---|---|---|
| Pemba rainy | 6.613 | 0.005 | ** |
| Pemba dry | 1.260 | 0.300 | NS |
| Zanzibar rainy | 2.140 | 0.140 | NS |
| Zanzibar dry | 1.200 | 0.320 | NS |
The difference in Chl-a concentration at the Pemba channel site during the rainy season was further analysed using Bonferroni Post-hoc means comparison test. It was found that Chl-a concentration was statistically significant between transects 2 and 1 and transects 3 and 2; whereas, there was no significant difference in Chl-a concentration between transects 3 and 1(Table 4.4).
| Transects | t-value | p-value | Significance |
|---|---|---|---|
| Transect 2 & 1 | 3.23 | 0.00974 | ** |
| Transect 3 & 1 | 0.17 | 1.00000 | NS |
| Transect 3 & 2 | -3.06 | 0.01477 |
|
4.5 The Physical-chemical Variables
The temporal and spatial distribution of physico-chemical variables depends on the season and study sites. The value of physico-chemical variables at Zanzibar channel site during the rainy and dry seasons are shown in Tables 4.5 and 4.6, respectively.
| Parameter | n | Minimum | Maximum | Mean | SEM (±) |
|---|---|---|---|---|---|
| SST | 30 | 27.20 | 28.10 | 27.79 | 0.040 |
| Salinity | 30 | 34.00 | 36.50 | 34.92 | 0.090 |
| pH | 30 | 8.01 | 8.11 | 8.08 | 0.005 |
| DO | 30 | 5.21 | 7.22 | 6.29 | 0.090 |
| Nitrate | 30 | 0.22 | 1.03 | 0.49 | 0.030 |
| Phosphate | 30 | 0.06 | 0.67 | 0.38 | 0.020 |
| Parameter | n | Minimum | Maximum | Mean | SEM (±) |
|---|---|---|---|---|---|
| SST | 30 | 26.00 | 29.00 | 27.35 | 0.09 |
| Salinity | 30 | 33.00 | 37.00 | 34.85 | 0.14 |
| pH | 30 | 7.01 | 7.92 | 7.68 | 0.03 |
| DO | 30 | 4.04 | 7.60 | 5.48 | 0.16 |
| Nitrate | 30 | 0.36 | 5.29 | 1.13 | 0.21 |
| Phosphate | 30 | 0.33 | 0.97 | 0.55 | 0.03 |
The mean, minimum, maximum and standard error of the mean of the physico-chemical variables at the Pemba channel site for both rainy and dry seasons are shown in Tables 4.7 and 4.8 respectively.
| Parameter | n | Minimum | Maximum | Mean | SEM(±) |
|---|---|---|---|---|---|
| SST | 30 | 27.40 | 29.10 | 28.09 | 0.10 |
| Salinity | 30 | 33.00 | 35.50 | 34.63 | 0.12 |
| pH | 30 | 7.95 | 8.06 | 8.03 | 0.01 |
| DO | 30 | 5.17 | 6.98 | 6.04 | 0.10 |
| Nitrate | 30 | 0.11 | 0.64 | 0.38 | 0.02 |
| Phosphate | 30 | 0.03 | 0.39 | 0.20 | 0.02 |
| Parameter | n | Minimum | Maximum | Mean | SEM(±) |
|---|---|---|---|---|---|
| SST | 30 | 27.30 | 29.50 | 28.34 | 0.090 |
| Salinity | 30 | 33.00 | 36.00 | 34.80 | 0.110 |
| pH | 30 | 7.94 | 8.04 | 8.01 | 0.005 |
| DO | 30 | 4.90 | 7.15 | 5.51 | 0.080 |
| Nitrate | 30 | 0.11 | 0.73 | 0.41 | 0.030 |
| Phosphate | 30 | 0.54 | 1.11 | 0.75 | 0.030 |
4.6 Influence of Environmental variables on Chlorophyll-a
The influence of the physico and chemical variables on the distribution and abundance of phytoplankton at the Pemba and Zanzibar channel during the dry and wet seasons was assessed multivariate data analysis methods with principal component analysis (PCA). During the rain seasone chlorophyll was positively related with phosphate, dissolved oxygen, nitrate and pH and negatively related with salinity and SST (Figure 4.12a). the influence of these variables vary with channel. While nitrate, and pH posivitely related with chlorophyll at Zanzibar channel, oxygen and phosphate have strong influence in the Pemba channel (Figure 4.12a). SST negatively infuenced chlorophyll during the rain season at Pemba channel and salinity affected chlorophyll negatively in Pemba and Zanzibar channel (Figure 4.12a). Like the rain season, the same environmental variables influenced chlorophyll concentration but in the reversed order (Figure 4.12b). Except for SST, that influenced chlorophyll negatively during the dry season, dissolved oxygen, nitrate, phosphate, pH, and salinity showed a positive influence with chlorophyll (Figure 4.12b)
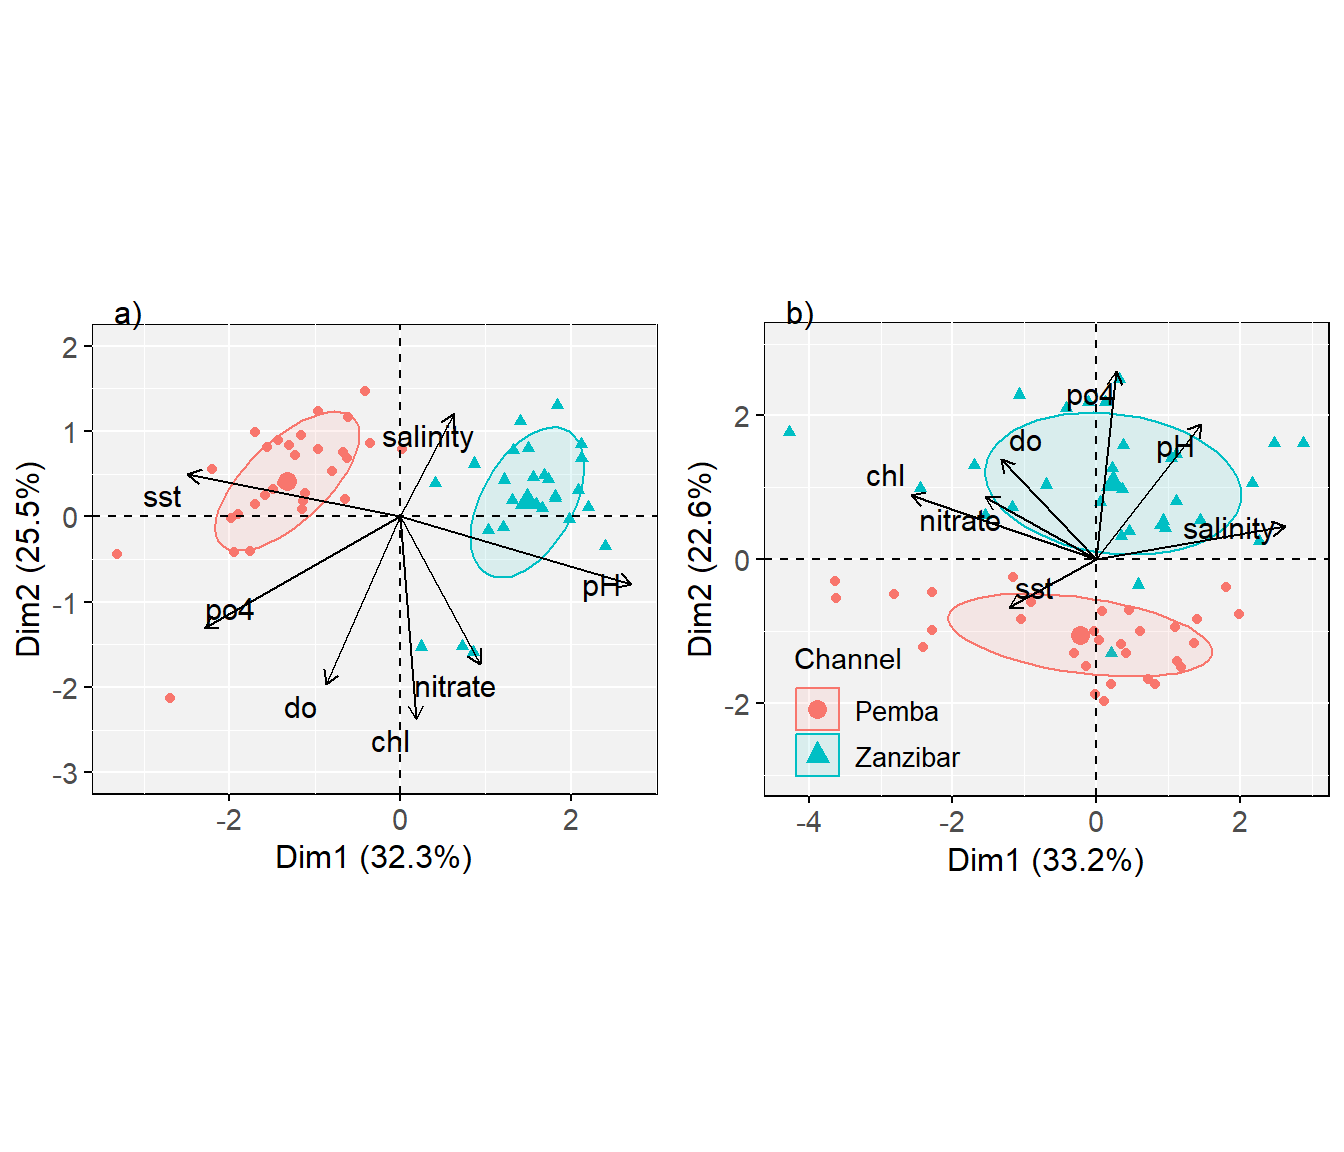
Figure 4.12: Principal Component Analysis (PCA) of the infulence of environmental variables on chlorophyll in Pemba and Zanzibar channels during the a) rain and b) dry seasons
The results revealed that, during the dry season, nitrate, phosphate and DO were positively and significantly correlated with the Chl-a, suggesting that the increase in these physico-chemical variables favoured phytoplankton biomass and abundance. Salinity was negatively and significantly correlated with Chl-a concentration, indicating that the increase in this variable tends to decrease Chl-a concentration (Table 4.9). The pH and SST showed a weak relationship with Chl-a (Table 4.9).
| Dependent variable | Independent variables | Correlation coefficient (r) | p value | Significance |
|---|---|---|---|---|
| Chl-a | Nitrate | 0.60 | 4.37 × 10⁻⁷ | *** |
| Chl-a | Phosphate | 0.28 | 0.03 |
|
| Chl-a | SST | -0.16 | 0.24 | NS |
| Chl-a | DO | 0.53 | 3.09 × 10⁻⁵ | *** |
| Chl-a | Salinity | -0.45 | 4.19 × 10⁻⁴ | *** |
| Chl-a | pH | 0.20 | 0.14000000000000001 | NS |
The relative weights of each of the six physico-chemical variables during the dry season, were examined using a multiple linear regression model which produced R² = 0.36, F(6, 53) = 5.01, p < 0.05 (Table 4.10). The results showed that nitrate, phosphate, DO and pH had significantly positive regression weights with Chl-a concentration indicating that, the increase in these variables were expected to increase Chl-a concentration, after controlling for other variables in the model. Therefore, the increase in one unit of nitrate, phosphate, pH and DO will increase Chl-a concentration by 1.33 × 10⁻⁵, 2.69 × 10⁻³, 9.20 × 10⁻⁴ and 7.93 × 10⁻⁵ units respectively (Table 10). The SST and salinity had significantly negative regression weights with Chl-a, indicating that the increase in these variables is expected to lower the value of Chl-a. Thus, the increase in one unit of SST will decrease Chl-a concentration by 5.58 × 10⁻⁵ units while the increase of one unit of salinity will decrease the concentration of Chl-a by 3.02 × 10⁻⁴ units (Table 4.10).
| Dependent | Independent | Coefficient | Error | t-value |
|---|---|---|---|---|
| Chl-a | Intercept | 3.58 × 10⁻³ | 9.56× 10⁻³ | 0.37 |
| Chl-a | SST | -5.58× 10⁻⁵ | 2.03 × 10⁻⁴ | -0.28 |
| Chl-a | pH | 9.20 × 10⁻⁴ | 3.12 × 10⁻⁴ | 2.95 |
| Chl-a | Salinity | -3.02 × 10⁻⁴ | 1.56 × 10⁻⁴ | -1.93 |
| Chl-a | DO | 7.93 × 10⁻⁵ | 1.70 × 10⁻⁴ | 0.47 |
| Chl-a | Phosphate | 2.69 × 10⁻³ | 7.57 × 10⁻⁴ | 3.55 |
| Chl-a | Nitrate | 1.33 × 10⁻⁵ | 1.30 × 10⁻⁴ | 0.10 |
Generally, during the dry season, nitrate and DO had a stronger correlation with Chl-a with the correlation coefficient of 0.6 and 0.53 respectively. However, the change in phosphate showed to have a stronger positive impact on Chl-a concentration in multiple regression analysis during this season.
During the rainy season nitrate and DO were positively and significantly correlated with Chl-a (Table 4.11), indicating that the increase in these variables tends to increase the Chl-a concentration in this season. Phosphate and pH were also positively but not significantly correlated with Chl-a (Table 11). SST and salinity were negatively and significantly correlated with Chl-a concentration indicating that the increase in these variables tends to decrease the Chl-a concentration (Table 4.11).
| Dependent | Independent | Coefficient | Error | t-value |
|---|---|---|---|---|
| variable | variables | NA | NA | NA |
| NA | Nitrate | 0.54 | 1.01 × 10⁻⁵ | *** |
| NA | Phosphate | 0.18 | 0.1608 | NS |
| Chl-a | SST | -0.47 | 2.3999999999999998E-3 | ** |
| NA | DO | 0.34 | 8.3999999999999995E-3 | ** |
| NA | Salinity | -0.56 | 5.35 × 10⁻⁶ | *** |
| NA | pH | 0.25 | 0.11 | NS |
The analysis with the multiple linear regression model between Chl-a and six physico-chemical variables during the rainy season, produced R² = 0.65, F(6, 53) = 16.31, p < 0.05. Nitrate, phosphate and DO had significant positive regression weights (Table 4.12), indicating that the increase in these variables is also expected to increase the values of Chl-a concentration, after controlling for the other variables in the model. So, the increase of one unit of nitrate, phosphate, and DO will increase Chl-a concentration by 0.87, 0.80, and 0.07 units, respectively (Table 4.12).
The SST, pH and salinity had a significantly negative weight indicating that variable with higher values were expected to lower Chl-a concentration. Thus, the increase of one unit of SST, pH and salinity will decrease Chl-a concentration by 0.02, 2.13 and 0.2 units, respectively (Table 4.12).
| Dependent | Independent | Coefficient | Error | t-value |
|---|---|---|---|---|
| NA | Intercept | 27.09 | 7.84 | 3.45 |
| NA | SST | -0.02 | 0.08 | -0.25 |
| Chl-a | pH | -2.13 | 1.01 | -2.10 |
| NA | Salinity | -0.29 | 0.07 | -4.30 |
| NA | DO | 0.07 | 0.06 | 1.06 |
| NA | Nitrate | 0.87 | 0.19 | 4.57 |
| NA | Phosphate | 0.80 | 0.25 | 3.28 |
In general, nitrate and salinity showed to have stronger influence on Chl-a concentration during the rainy season, with the correlation coefficient of 0.54 and -0.56 respectively. However, the change in pH showed to have stronger negative impact on Chl-a concentration in multiple regression analysis in this season.
4.7 Comparison Between Satellite and in situ Chlorophyll-a Concentration
The extracted satellite and in situ Chl-a concentration were imported into OriginPro statistical software for further analysis. The descriptive statistics for the satellite and in situ Chl-a were calculated and the simple arithmetic values for the in situ and satellite Chl-a are summarized in Table 4.13.
| Statistics | In situ | Satellite |
|---|---|---|
| N total | 58.00 | 58.00 |
| Mean | 0.08 | 0.65 |
| Standard Deviation | 0.16 | 0.28 |
| SE of mean | 0.02 | 0.04 |
| Minimum | 0.00 | 0.23 |
| Median | 0.00 | 0.56 |
| Maximum | 0.77 | 1.69 |
The correlation between satellite and in situ Chl-a concentration showed a stronger relationship for both rainy and dry seasons (Figure 4.13). There was a stronger positive and significant correlation between satellite and in situ Chl-a during the rainy season (r = 0.86, p < 0.05). During the dry season, the satellite Chl-a was also positively and significantly correlated with the in situ Chl-a though the relationship was marginally weaker than that of the rainy season (r = 0.74, p < 0.05). However the satellite Chl-a concentration was observed to be much higher than the in situ Chl-a concentration for both seasons (Figure 4.13).
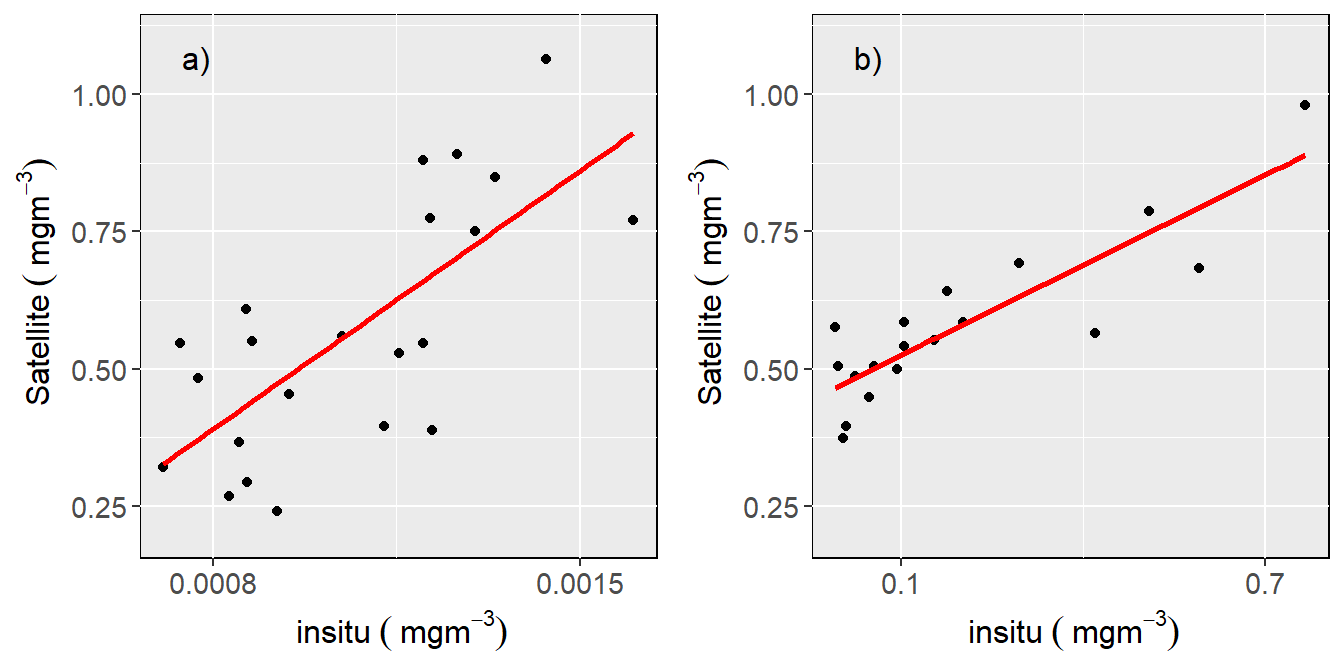
Figure 4.13: Comparison between satellite with the in situ chlorophyll-a concentration during the a)dry and b) rainy season
References
Richmond, Matthew D, and others. 2002. “A Field Guide to the Seashores of Eastern Africa and the Western Indian Ocean Islands.” Stockholm (Sweden) SIDA/UDSM.
McClanahan, Timothy R. 1988. “Seasonality in East Africa’s Coastal Waters.”