Chapter 3 Methods
3.1 Description of the Study Areas
The research was carried out in two selected sites within Pemba (Figure 3.1) and Zanzibar channels (Figure 3.2). The Zanzibar channel site was chosen so as to determine the influence of sewage effluent (human activities) on the phytoplankton. The Pemba channel site was selected in order to determine the influence of fresh water on the distribution and abundance of the phytoplankton. The easy accessibility of laboratory facilities at the Pangani IMS centre was the other factor for the selection of the Pemba channel site.
The Pemba channel which is about 700-800 m deep (Shaghude and Wannäs, 1998) and approximately 100 km long and 50 km wide (Rödder et al., 2010) separates the Tanzania mainland from the Pemba Island (Figure 3.1). The Pemba channel is considered to be part of the ancient Pangani river delta which was later down-faulted to form the deep channel between Tanzania mainland and the Pemba Island (Shaghude, 2001) while the northern most part of this channel faces the coast of Kenya.
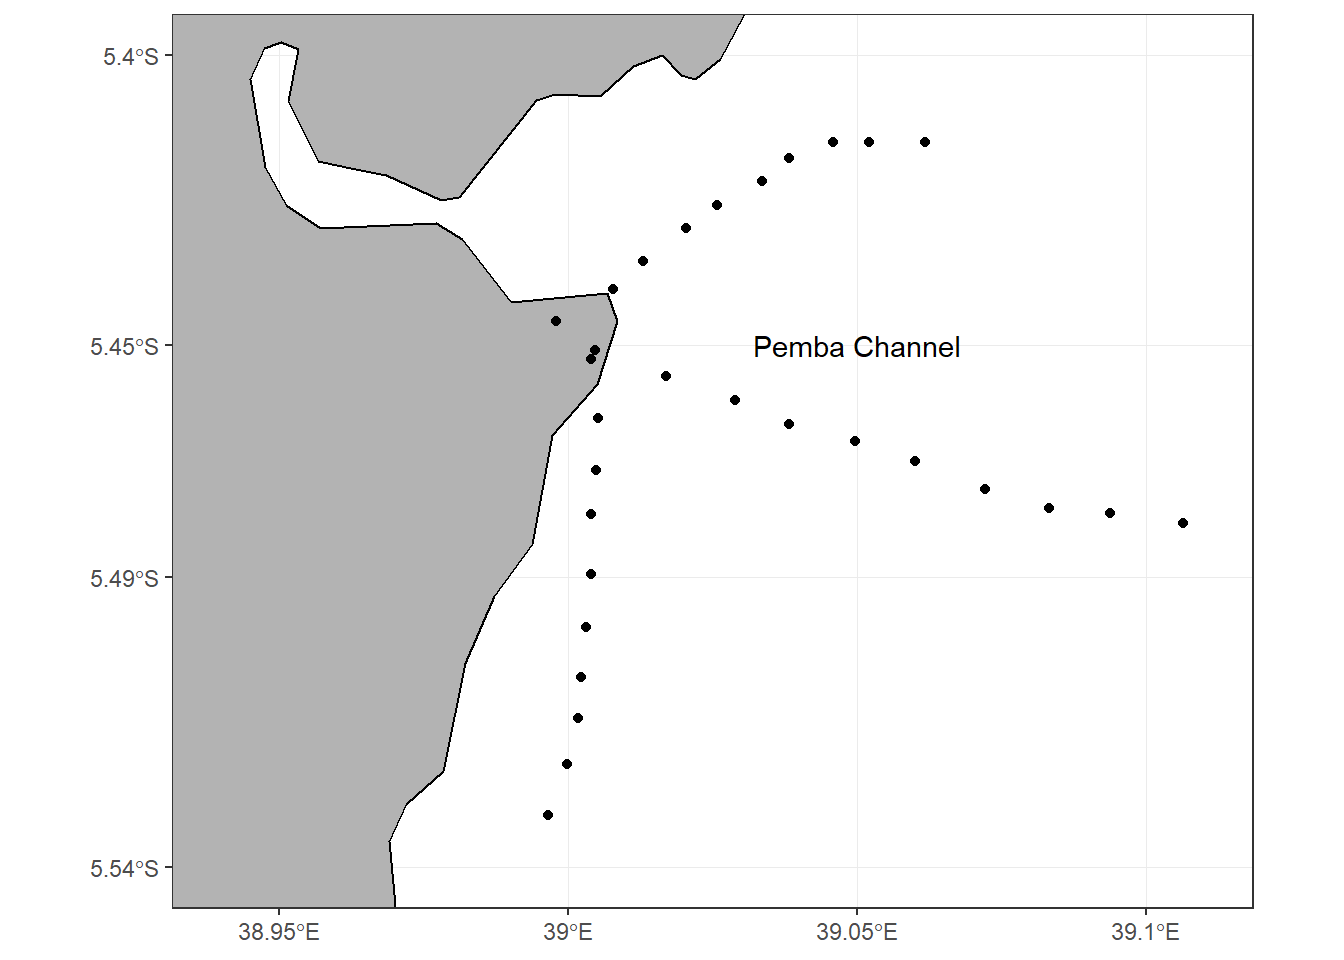
Figure 3.1: Map of Pemba channel showing the sampling stations along three transects
The Zanzibar channel (Figure 3.2), located south of Pemba channel, separates the island of Unguja and Tanzania mainland. The channel is relatively shallow (less than 50 m depth) and it is approximately about 120 km long and 35 km wide (Shaghude and Wannäs, 2000). The Zanzibar channel is considered to be part of the ancient Ruvu River delta (Shaghude and Wannäs, 1998).
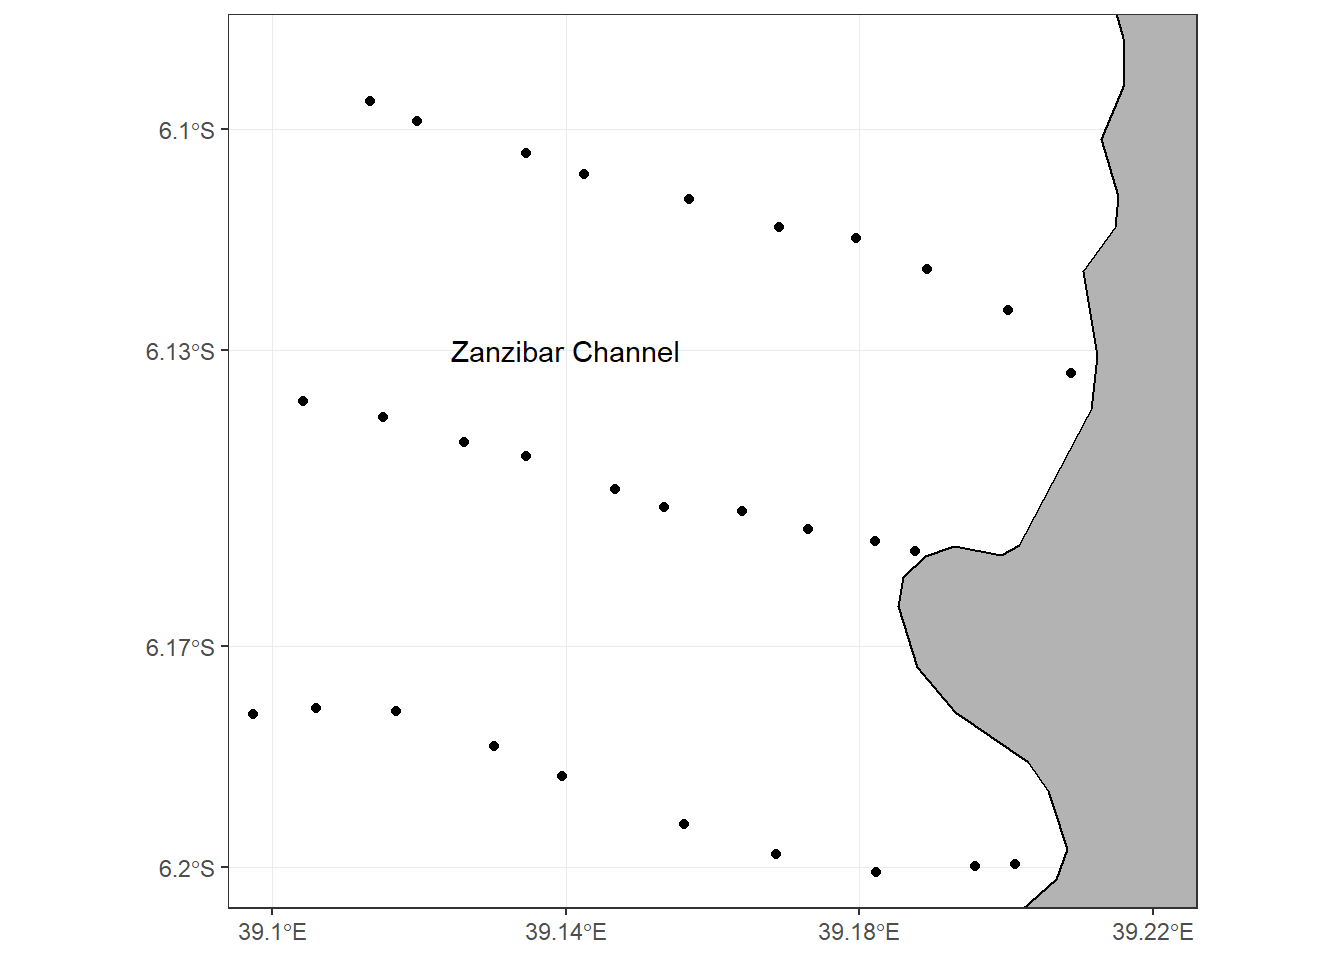
Figure 3.2: Map of Zanzibar channel showing the sampling stations along three transects
The climate within Zanzibar and Pemba channels is subjected to two alternating and distinctive seasons, the northern and southern monsoons, which have a marked effect on air and water temperature, winds and rainfall. Winds are a particularly important feature of the western Indian Ocean, driving the water circulation and affecting wave action, local climate, biological processes and human activities (Richmond, 2011).
During the months of November to March, the prevailing trade winds are the NE monsoon winds. The NE monsoon wind is usually steady and light, about 5 ms-1. It is usually associated with short rainy periods and the true rainy season begins after the NE monsoon, from March to June. From June to September, the area experience a complete reversal in wind direction, a feature unique to the Indian Ocean, and the SE monsoon wind prevail. This period is characterized by relatively strong winds, reaching an average velocity of 9 ms-1. Air temperature at sea level rarely falls below 20oC and sea water temperature usually reaches a minimum of 25oC in September and rises to a maximum of 29oC in March (McClanahan, 1988).
3.2 Sampling Design
Field data collection was conducted during both the dry season (January and February) and the rainy season (April). Sampling of physical, chemical and biological parameters was done once in each season for every site, making a total of two sampling campaigns for each study site. At the Zanzibar channel site, three cross-shore transects (proximal to the Zanzibar Town) with spatial separation of about 4 km (Figure 3.2) were chosen. Each transect was approximately 10 km long, and with ten sampling stations separated by approximately 1 km. At the Pemba channel site, the sampling transects were all designed to start from the Pangani river mouth (Figure 3.1). Two of the three transect (Transect 2 and Transect 3) were running either north-easterly or south-easterly to allow assessment of the influence of monsoonal variability. Transect 3 was shorter than transect 1 and 2 due to roughness of the ocean which leads to instability of the boat as a result drifting of the boat backward.
3.3 Data Collection Types and Techniques
Two types of data were collected, the primary described in section 3.3.1 and secondary data expanded in section 3.3.2.
3.3.1 In situ Data
The in situ data collected included SST, pH, salinity, and DO. These data were acquired using different measuring devices. The SST and pH measurements were acquired using a pH meter. The salinity measurements were obtained using a hand-held refractometer and DO was measured using a DO meter. Water samples for determination of Chl-a concentration and nutrients (nitrates and phosphate) were collected from the surface using one and half litre water bottles.
3.3.1.1 Geographical Location of Sampling Stations
During the dry season, locations of the sampling stations were recorded using a hand held Geographical Positioning System (GPS). In order to ensure that subsequent samples during the rainy season were collected on the same locations of the previous sampling stations, Samsung Galaxy Smartphone which was running using an Android Operating System (with Essential GPS) Apps was used. The file that contains thirty geographical locations at Pemba Channel (Figure 3.1) and Zanzibar Channel (Figure 3.2) was loaded into Essential GPS App as waypoints. With its high capability of navigation and ability to show cached Google Map offline as well as using data connection internet, navigation to the positions recorded in earlier field determined with Essential GPS App.
During navigation to the sampling points along a given transect, the GPS in the smartphone was turned on and each sampling point (waypoint) was set as target in essential GPS App environment, which was later used to guide the boat for navigation towards the targeted sampling points. Because of the clear atmosphere and absence of obstacles in the oceanic water, targeted sampling station were located at an accuracy of about \(\pm\) 2 meters.
3.3.1.2 Laboratory Analysis
Water samples collected for Chl-a were taken into the laboratory and filtered through membrane filters (pore size 0.45μm). 500ml of water sample was used for filtration. Filters were folded in aluminium foil and stored in a Ziplok bag and kept in freezer for subsequent analysis. Due to lack of laboratory equipment for Chl-a determination at Pangani, the frozen filters were stored in icebox with ice inside and transported by air from Tanga to Zanzibar for subsequent analysis at the Institute of Marine Sciences laboratory.
3.3.1.2.1 Calibration of the Fluorometer
Before Chl-a measurements, the fluorometer (Aquafluoro-turner Designs model 8000-010) was calibrated following the Joint Global Ocean Flux Study (JGOFS) protocols (UNESCO, 1994). From the calibration process, the linear calibration factor \(K_x\) was calculated as the slope of non-acidified fluorometric reading versus Chl-a concentration of the standard calculated spetrophotometrically. The acidification coefficient \(F_m\) was also calculated by averaging the ratio of the non-acidified and acidified fluorometric readings \(\frac{F_o}{F_a}\) of Chl-a dilutions of the standard.
3.3.1.2.2 Chlorophyll-a Extraction and Measurements
Filters were placed in test tubes and 10ml of 90% acetone solution was added. These tubes were then covered with aluminium foil and kept in the refrigerator to allow for chlorophyll-a extraction. After two days, the test tubes were removed from the refrigerator and centrifuged at a speed of 3000 revolution per minute (rpm) for 10 minutes, and then put into the cuvette. A fluorometer was used to determine the reflectance value of Chl-a in the cuvette. The fluorometer reading before addition of acid in the sample was recorded (F0), to obtain corrected Chl-a, 2 drops of 10% HCl was added in the cuvette, a new fluorometer reading after addition of acid was recorded (Fa). The concentration of chlorophyll-a in the sample were then calculated using equation (3.1) described by Lorenzen (1966).
\[ \begin{equation} \phi = \frac{F_m}{F_m - 1} \times (F_o-F_a) \times k_x \times \frac{vol_{ex}}{vol_{filt}} \tag{3.1} \end{equation} \]
Where: \(\phi\) = chlorophyll conentration \(F_m\) = acidification coefficient, average of (Fo/Fa) \(F_o\) = reading before acidification \(F_a\) = reading after acidification \(K_x\) = calibration coefficient \(V_{ex}\) = extraction volume \(V_{filt}\) = sample volume
3.3.1.2.2.1 Nutrient Determination
A portion of filtered water was used to determine nutrient using a spectrophotometer (type UV-1601 Shimadzu). Nitrate concentration was determined using Parson et al., (1989) cadmium reduction method while phosphate levels were determined by the method of Murphy and Riley as described by Parson et al., (1989).
3.3.1.3 In situ Data Processing
The in situ data obtained, were first processed before actual analysis. The methodology used in processing the data is described in the foregoing sections (section 3.3.1.3.1 and section 3.3.1.4):
3.3.1.3.1 Data Preparation
The geographical locations of sampling stations for the Pemba and Zanzibar channel sites were downloaded as GPS standard format (Gpx) and converted to Text Delimited file (txt) using MapSource software version 6. The file was then imported into Microsoft excel spread sheet, where all other laboratory analysed data (chlorophyll-a concentration, nitrate and phosphate) and direct collected field data (DO, Salinity, pH and SST) were compiled with their respective sampling stations. An automated model (Figure 3), which loops a series of geo-processing operations was built using ESRI ModelBuilder by incorporating several geo-processing tools of ArcGIS Toolbox 10.1.
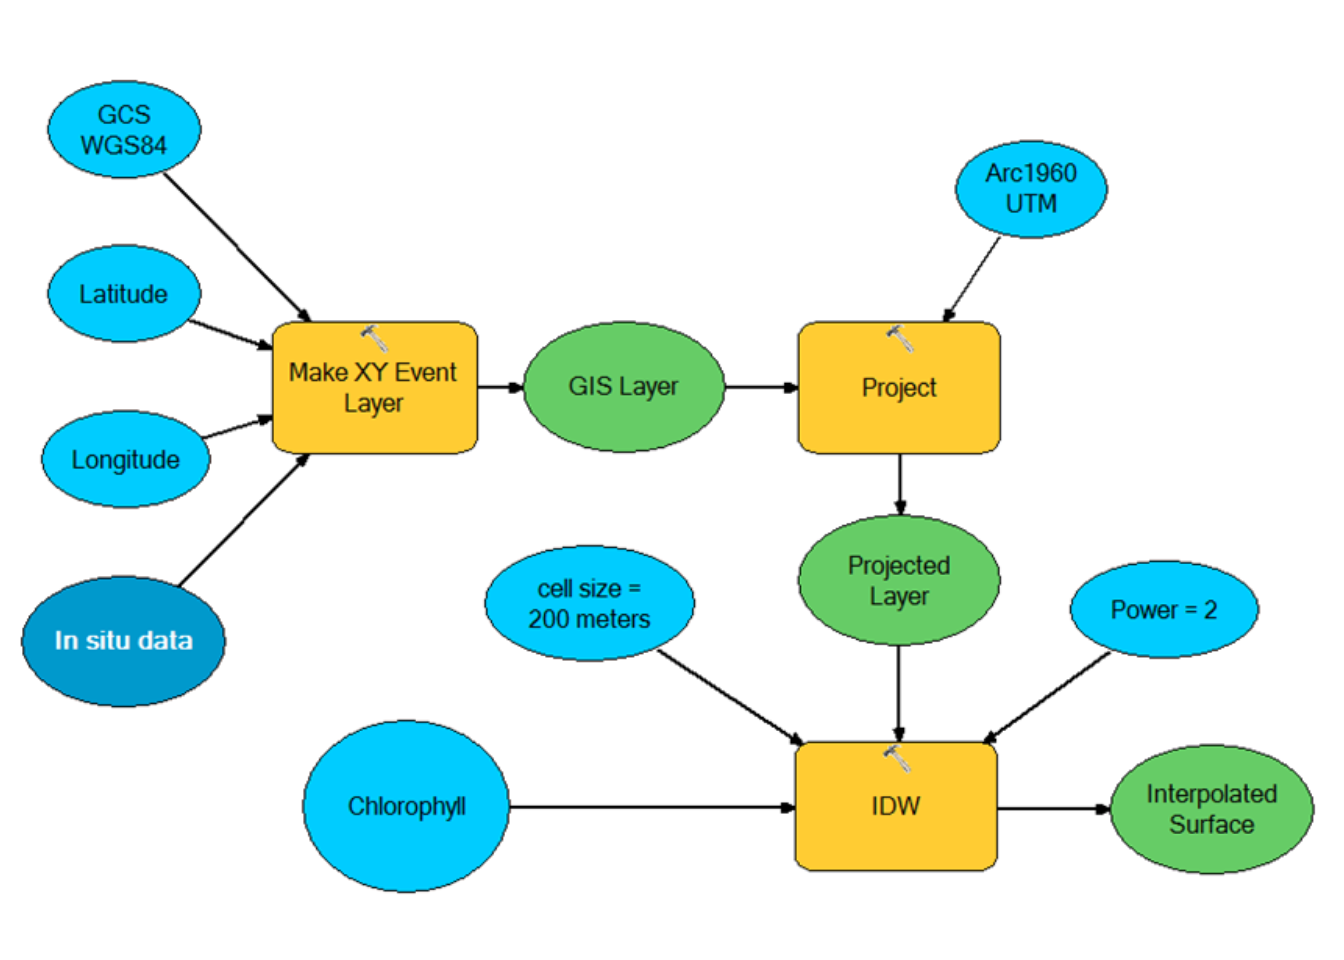
Figure 3.3: The Model created to process in situ variables and creates surface datasets of physical, chemical and biological parameters.
3.3.1.4 Creation of Raster Surface Layer Datasets
The Inverse distance weighting (IDW) method with a second order power was used to interpolate and create surface datasets of physical, chemical and biological parameters for each study site during the dry and rainy seasons. IDW is one of the most common methods of spatial interpolation; which estimates the value of an unknown location by averaging the values of nearby sample points (Watson and Philip, 1985). With this interpolation procedure the data points closer to the sampling points are considered to have higher weights than data points further away from the sampling points where the weights decrease exponentially as a function of distance from the sampling point (Figure 3.4).
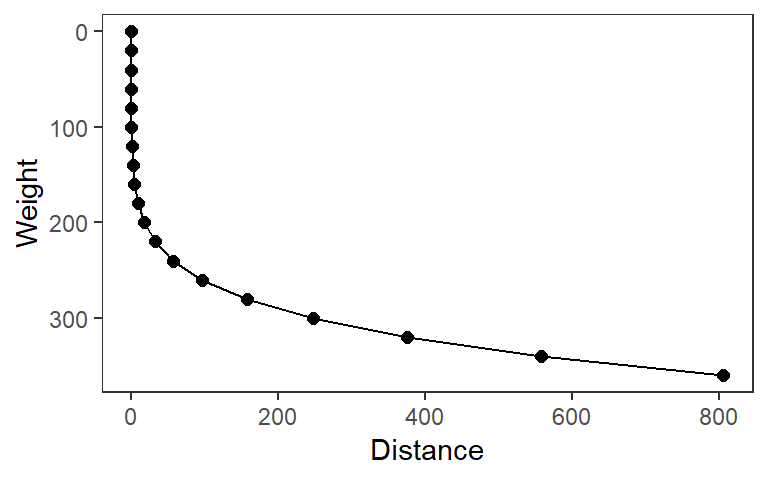
Figure 3.4: The Inverse Distance Weighting (IDW)
According to Watson and Philip (1985), the IDW is based on the interpolation principle which state:
the closer a sample point is to the location being estimated, the more influence, or weight, it has on the estimate Philip (1985)
The formula used to average the nearby sample points includes a weighting factor to account for spatial autocorrelation. The usual weighting factor is inverse distance squared (n=2). This means that a sample point’s influence decreases in proportion to the square of its distance from the estimated point. The simplest weighting function (w) is the inverse power of distance computed with equation (3.2) described by Watson and Philip (1985):
\[ \begin{equation} w(d) = \frac{1}{d^n} \tag{3.2} \end{equation} \]
3.3.2 Satellite Data
The satellite derived Chl-a data used in this study were obtained from Natural Environment Research Council (NERC) Earth Observation Data Acquisition and Analysis Service (NEODAAS) server. The imageries were obtained from the Moderate-resolution Imaging Spectro-radiometer (MODIS) Aqua sensor. The imageries were georeferenced and stored as Network Common Data Form (NetCDF ) format. To study the seasonal and spatial variability of Chl-a within the study areas, monthly composite Chl-a imageries with a spatial resolution of 500 m for the period of January through December 2012 were used.
The satellite SST data were obtained from Tanzania Fisheries Research Institute (TAFIRI), which owns a GeonetCast ground receiving station. The station had been acquiring MODIS data since January 2012. As cloud cover obscured most of the daily SST composite imageries three day composite imageries for January through December 2012 with a spatial resolution of 1 km were found to be more suitable for the analysis. The three days composite SST imageries were therefore used in the present study in preference to the former imageries. The imageries were first georeferenced and then stored as Geographic Tagged Image File Format (GeoTIFF).
In order to obtain monthly composite, the three day composite SST imageries for a given month were imported into the Quantum GIS (QGIS) software version 1.8.0 using Build Virtual Raster (Catalog) and these were then exported and saved in virtual format (vrt). The virtual format SST imageries for January through December 2012 were then imported into ArcGIS software where they were transformed and saved in TIFF format.
Selected Chl-a imageries were imported into ArcGIS using Make NetCDF Raster Layer Tool. Both SST (TIFF) and Chl-a imageries were sampled to the study area using clip tool and the sampled imageries were then positioned on actual location on the earth surface using Geographic Coordinate System of World Geodetic System of 1984 (GCS WGS 84). Cloud cover obscured some of imageries making some cells not having the SST or Chl-a values. All cells which had no values were assigned as NoData and made transparent for the selected satellite imagery using image analysis window which contains specialized raster and image enhancement tools.
3.3.3 Extraction of Chlorophyll-a Concentration from Satellite Images
Due to ArcGIS limitation in performing raster to raster correlation analysis, the monthly Chl-a concentration and SST from satellite imageries that falls within the in situ sampling stations were extracted and stored in feature class dataset. Since this scenario involved running the same sequences of tools for several images, a model was created to automate the process (Figure 3.5).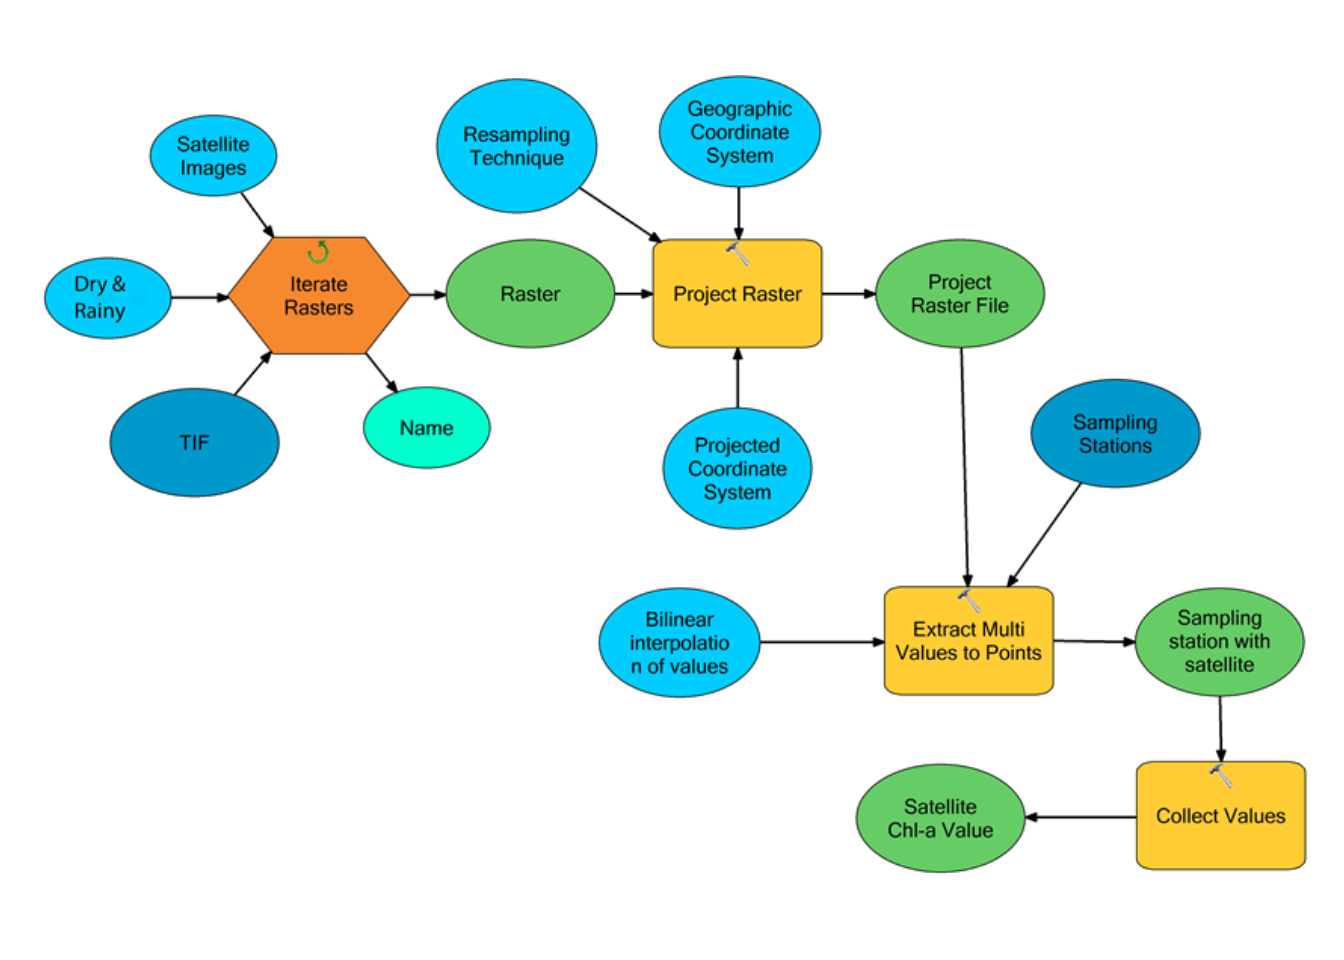
Figure 3.5: A Geoprocessing model created to automate processed for extracting chlorophyll-a and SST data from satellite images
The automation process allowed to avoid carrying out the same extraction process several times each month for Chl-a and SST. A model was constructed using Model Builder; an interactive program that allowed the users to chain tools together, using output of one tool as input in another. Explanation of some key stages of this model is described below:
- The NetCDF variable is a workspace folder containing selected satellite Chl-a imageries that were iterated while the TIFF variable is a workspace folder containing selected satellite SST imageries that were iterated. Each iteration produced a raster variable which was connected as input to the project raster tool, where the raster spheroid coordinate system was transformed from World Geographic System (WGS84) to a flat surface Universal Transverse Mercator (UTM Zone 37S).
- The Extract Multi Value To Points Tool was used to extract each satellite imageries Chl-a and SST values by spatial location. This tool extract SST and Chl-a concentration at locations of in situ sampling stations and records the values to the attribute table of the point feature class, which is also used as input in the model apart from the raster.
- The extracted Chl-a and SST values from satellite imageries were then collected by Collect Value Tool, which is designed to collect the output values of the iterator. Then the attribute table of sampling station point feature class, which contain both in situ and satellite Chl-a concentration and SST were exported and compiled into Excel spreadsheet.
The extracted spatial data from spreadsheet was then imported into OriginPro statistical package for further analysis.
3.3.4 Comparison Between Satellite and in situ Chlorophyll-a Concentration
Of all the stations where in situ data were collected, the stations that were on a cloud/haze-free pixel of satellite image were considered for the comparisons. To give a greater number of data points for correlation and to reduce uncertainty and noisy in statistical data analysis and also to matchup satellite data with the in situ Chl-a data, mean satellite Chl-a concentration for January, February, July, August, September, October, November and December were pooled together to represent the dry season where as the mean for March, April, May and June represented the rainy season. Satellite Chl-a concentration for rainy and dry seasons for the year 2012 were used for correlation with in situ Chl-a concentration using Pearson’s product moment correlation analysis.
3.4 Data Analysis
Spatial and temporal distribution of chlorophyll-a at different time scales were investigated using ArcGIS Spatial Analyst Extension Version 10.1. All statistical analyses were performed using OriginPro statistical and graphic software version 8.6. Data were checked for normality and homogeneity of variances, and transformed where necessary. Kruskal-Wallis ANOVA (KWANOVA) test was used to determine the significant variation of chlorophyll-a and SST among months. Mann Whitney U-test was used to test for significant difference in chlorophyll-a concentration between dry and rainy seasons. The spatial and temporal variation of chlorophyll-a concentration between Pemba and Zanzibar channels, were analysed using Analysis of Variance (one way ANOVA), which was followed by post-hoc Bonferroni means comparison test.
The variability of chlorophyll-a between transects within the study sites was also determined using one way ANOVA which was followed by post-hoc Bonferroni means comparison test. To ascertain the factors for spatial and temporal variation of phytoplankton at both sites, the physical-chemical variables were compared with chlorophyll-a concentration using Pearson’s product-moment correlation (r) and multiple linear regression analyses. The correlation between satellite and in situ chlorophyll-a concentration was also determined using Pearson’s product-moment correlation (r) analysis.